
 |
Volume Spread Analysis |
Post Reply 
|
Page 12> |
| Author | |
jalna 
Regular 
Joined: 31 Mar 2007 Posts: 95 |
 Post Options Post Options
 Quote Quote  Reply Reply
 Topic: Volume Spread Analysis Topic: Volume Spread AnalysisPosted: 15 Sep 2008 at 7:51pm |
|
see discussion under" Better Volume" thread
|
|
 |
|
cmacdon 
BullCharts Guru 
Joined: 09 Sep 2012 Location: Brisbane Posts: 236 |
 Post Options Post Options
 Quote Quote  Reply Reply
 Posted: 10 Sep 2012 at 11:30am Posted: 10 Sep 2012 at 11:30am |
|
|
|
 |
|
cmacdon 
BullCharts Guru 
Joined: 09 Sep 2012 Location: Brisbane Posts: 236 |
 Post Options Post Options
 Quote Quote  Reply Reply
 Posted: 10 Sep 2012 at 11:49am Posted: 10 Sep 2012 at 11:49am |
|
After doing much reading and a lot of analysis on VSA, the specific indicators tend to be very judgemental. My own coding is 20 A4 pages so it is very unlikly my interpretation of VSA will be the same as anyone elses other than the general thrust of the SOS and SOW principles should be working.Consequently, here is my Bullcharts VSA coding framework showing the variables involved in many of the VSA indicators and two example Sign of weakness 1 and Sign of strength 1 indicators, and source of information i used for my interpretation of those specificators .You can copy and past and add your own additional codes in similar fashion to complete your anaysis of VSA, if you so wish.
I also attach a second indicator to colour code the volume bars. [citation =" Wyckoff Supply & Demand CMD This has now
been coded using various sources of Volume Spread Analysis - Undeclared Secrets
and Master of the Markets by Tom Williams, and Master Class 4/4/2010, and
Trading in the Shadow of Smart Money Vol2 (TSSM), and That was the week that
was by Tom Williams. VSA is largely judgemental. The threshold weightings below allow my
interpreatation for the Bullchart coding
CMD"] {In summary there may be a number of indicators for
each of these Principles of weakness 1 End of rising market 2 No Demand at Market Top 3 No Result from effort 4 Upthrusts 5 No Demand on Downtrend 6 Widespread down through previous support 7 Buying Climax 8 Top Reversal Principles of Strength 1 Bottom Reversal 2 Stopping Volume 3 Tests 4 Absorption 5 Bagholding 6 Selling Climax 7 Shakeout 8 No Supply in a rising market} {-------------------------------------------------------------------------------------------------------} { The selection of an appropriate trend calculation
method is most critical as many SOS and SOW indicators depend on whther trend
is up or down.} [target=Price] Vib:=input("Vibration", 4, .001,
100); Z:=Zig(If(Outside() AND Ref(H,-1)>Ref(H,-2),H,If(Outside() AND Ref(L,-1)<Ref(L,-2),L,If((Outside() OR Inside()) AND C>O,H,If((Outside() OR Inside()) AND O>C,L,If(H>Ref(H,-1),H,If(L<Ref(L,-1),L,If(Ref(H,-1)>Ref(H,-2),H,If(Ref(L,-1)<Ref(L,-2),L,C)))))))),Vib,%); Trendup:=Z>ref(z,-1); Trenddown:=Z<=ref(z,-1); {-------------------------------------------------------------------------------------------------------} prd1:=input("Period for Volume MA", 30, 1, 200); prd2:=input("Period for Total Spread
MA", 200, 1, 200); Cut:=input("Narrow Spread Cut
off", 0.5, .05, 0.8); Cut2:=input("UltraWS Cut off", 1.2, .05,
2.0); method
:= inputma("Method",SIMPLE); THExLo:=input("Extreme Low Vol Maximum
Threshold", 0.70, .1, 2); THLo:=input("Maximum for Low Vol
Threshold", 1.0, .1, 2); THNo:=input("Ultra High Minimum Vol
Threshold", 1.3, .1, 2.00); Uf:=input("Upthrust % on previous
High", 1.0005, .05, 2.0); Tf:=input("Test decline
factor", 0.9995, .05, 2.0); Range
:= H - L; ExtremeLowVol:=If(V<=THExLo*ma(V,prd1,s),V,0); LowVol:=If(V>THExLo*
ma(V,prd1,s) and V<=THLo*ma(V,prd1,s), V, 0); HighVol:=If(V>THLo*
ma(V,prd1,s) and V<=THNo*ma(V,prd1,s), V,0) ; UltraHighVol:=If(V>THNo*ma(V,prd1,s),V,0); Upbar:= C>Hist(C,1); Levelbar:=Hist(C,1); {used for TW Easy
Trend rules} Downbar:=
C< Hist (C,1); GapUp:=L>= Hist (H,1); GapDown:=H<= Hist (L,1); NS:=(Range<=Cut*ma(Range,prd2,method)); WS:=(Range>Cut*ma(Range,prd2,method)
) and (Range<Cut2* ma(Range,prd2,method)); UltraWS:=(Range>=Cut2*ma(Range,prd2,method) ); UltraBear:=C<=((Range*0.2)+L); Bear:=C>((Range*0.2)+L) AND C<=((Range*0.50)+L); Bull:=C>((Range*0.50)+L) AND C<=((Range*0.80)+L); UltraBull:=C>((Range*0.80)+L); {SOS 1 Bottom Reversal} SOS1:= If ( (TrendDown OR (Trendup and Hist(c,1)<Hist(c,15))) AND
L<Hist(L,1) AND
Ultrabull AND
(upbar or C=Hist(c,1)) AND
(Hist(Bull,1) OR Hist(Bear,1) OR Hist(Ultrabear,1)) AND
(WS OR UltraWS) {Distinguish from
version 1a} AND
(HighVol OR
Ultrahighvol) AND
(Hist(C,1)<=Hist(C,2) AND Hist(C,1)<=Hist(C,3) AND Hist(C,1)<=Hist(C,4) AND Hist(C,1)<=Hist(C,5)) AND
(Hist(L,1)<=Hist(L,2) AND Hist(L,1)<=Hist(L,3) AND Hist(L,1)<=Hist(L,4) AND Hist(L,1)<=Hist(L,5)),1,0); [name=1 brS; linestyle=marker; marker=long; fontsize=8; tooltip="SOS 1 Bottom Reversal - based on two bars a variety
of versions. Second bar is rapidly marked up to lock in traders that shorted or
to lock you out if you want to buy the market.
People hesitate buying as the shares look expensive relative to
yesterday. THIS VERSION HAS HIGH VOLUME INDICATING SUPPLY IS
STILL PRESENT. We can expect the market to come back down within a few days to
test to see if supply has dried up. (See
SOS1a There is high volume on the second day it indicates supply and we can
expect the market to come back down within a few days to test to see if supply
has dried up). Gavin Holmes Trading in
theShadow of the Smart Money78,79,97.";]; SOS1; {SOW 1S End of Rising Market. Similar to SOW 81b Selling Pressure. Per TW 061110 Markets TOP OUT on NS upbars} SOW1S:= If(H=Highest(H,25) AND
TrendUP AND
(Upbar Or C=Hist(c,1)) AND
UltraHighVol {Vol
=Supply Or See V2 Extreme low Vol No Demand} AND
(NS OR WS) {Added WS as some TG
NS indicators were not getting picked up} {Added Ultrabull as TG indicators sometimes show
close=High} AND
(Ultrabear OR
Bear ),1,0); [name=1 ermSup; marker=short; fontsize=8; tooltip="SOW 1S End
of rising market Supply - Don't see too often Fresh new ground to the left is
not 10 bars but 2 to 3 months or a year per Tom Williams. Gavin Holmes uses 500 bars Psychology: a) Uptrend to the left into fresh new
ground. . b) GapUp in the morning is a
strong sign but some variations have no Gap Up c)SM is selling to satisfy
surges of demand hence putting a cap on higher prices and the NS. d) Buy orders
are being rapidly satisfied. If SM had been buying there would be a wide spread
f)the Close does not make a difference what counts is the NS g)
Ultrahighvol. This is a serious sign of
weakness Gavin conservative approach Follow Up:Wait for
market to mushroom over if you are going to short. Mkt should make lower highs each day. Wait for at least 10 bars in any time frame
to see the result of weakness. TW would jump[ in. In strong down trend there should be increasing vol
on Down bars and decreasing Vol on Up bars.
Wait for a No Demand up bar, an upthrust on either high or low volume in
order to short. The end of a down trend
is often 2 consecutive Up bars followed by a Test or No Supply Down bar. TSSM
5,14,21,22,23,24,30,71 ";]; SOW1S; {-------------------------------------------------------------------------------------------} {This section takes up price colour bars equal to
Volume bars for VSA codes} { Volume Spread Analysis [description="VSA Volume Indicator CMD"]} [target=Price; linestyle=PriceColor] [name=Low Vol; Color=Lime Green] { Low volume} LowVol; [name=High Vol; Color=Dark Violet] { High Volume climax} HighVol; [name=Ultra High Vol; Color=Red] { Ultra High Volume} UltraHighVol; [name=Extreme Low Vol; Color=Orange] {Extremely Low Volume} ExtremeLowVol; {End of Indicator 1 } { Volume Spread Analysis Colour Volume Bars } [description="VSA VOLUME Bars Colours adj weightings "] prd1:=input("Period for MAs", 50, 1,
200); THExLo:=input("Extreme Low Maximum
Threshold", 0.7, .1, 2); THLo:=input("Maximum for Low
Threshold", 1.0, .1, 2); THNo:=input("Extreme High Minimum
Threshold",1.3, .1, 2); Range
:= High - Low; Value1
:= Volume; [linestyle=Bar; width=4] {[name=Normal Vol; Color=Gray] { Normal } Volume;} [name=Extreme Low Vol;Color=Orange] {Extremely Low Volume} If(Value1 <=THExLo*ma(V,prd1,s),V,0); [name=Low Vol;Color=Lime Green] { Low volume} If(Value1 >THExLo* ma(V,prd1,s) and v <=THLo*ma(V,prd1,s), V, 0); [name=High Vol;Color=Dark Violet] { High Volume climax} If(Value1 >THLo* ma(V,prd1,s) and v<=THNo*ma(V,prd1,s), V,0) ; [name=Ultra High Vol;Color=Red] { Ultra High Volume} If(Value1 >THNo*ma(V,prd1,s),V,0); |
|
 |
|
cmacdon 
BullCharts Guru 
Joined: 09 Sep 2012 Location: Brisbane Posts: 236 |
 Post Options Post Options
 Quote Quote  Reply Reply
 Posted: 17 Sep 2012 at 10:22am Posted: 17 Sep 2012 at 10:22am |
|
Finally got images working. If any interest, here is BHP at end of GFC run down period and turning point with my VSA indicators, Volume and ribbon 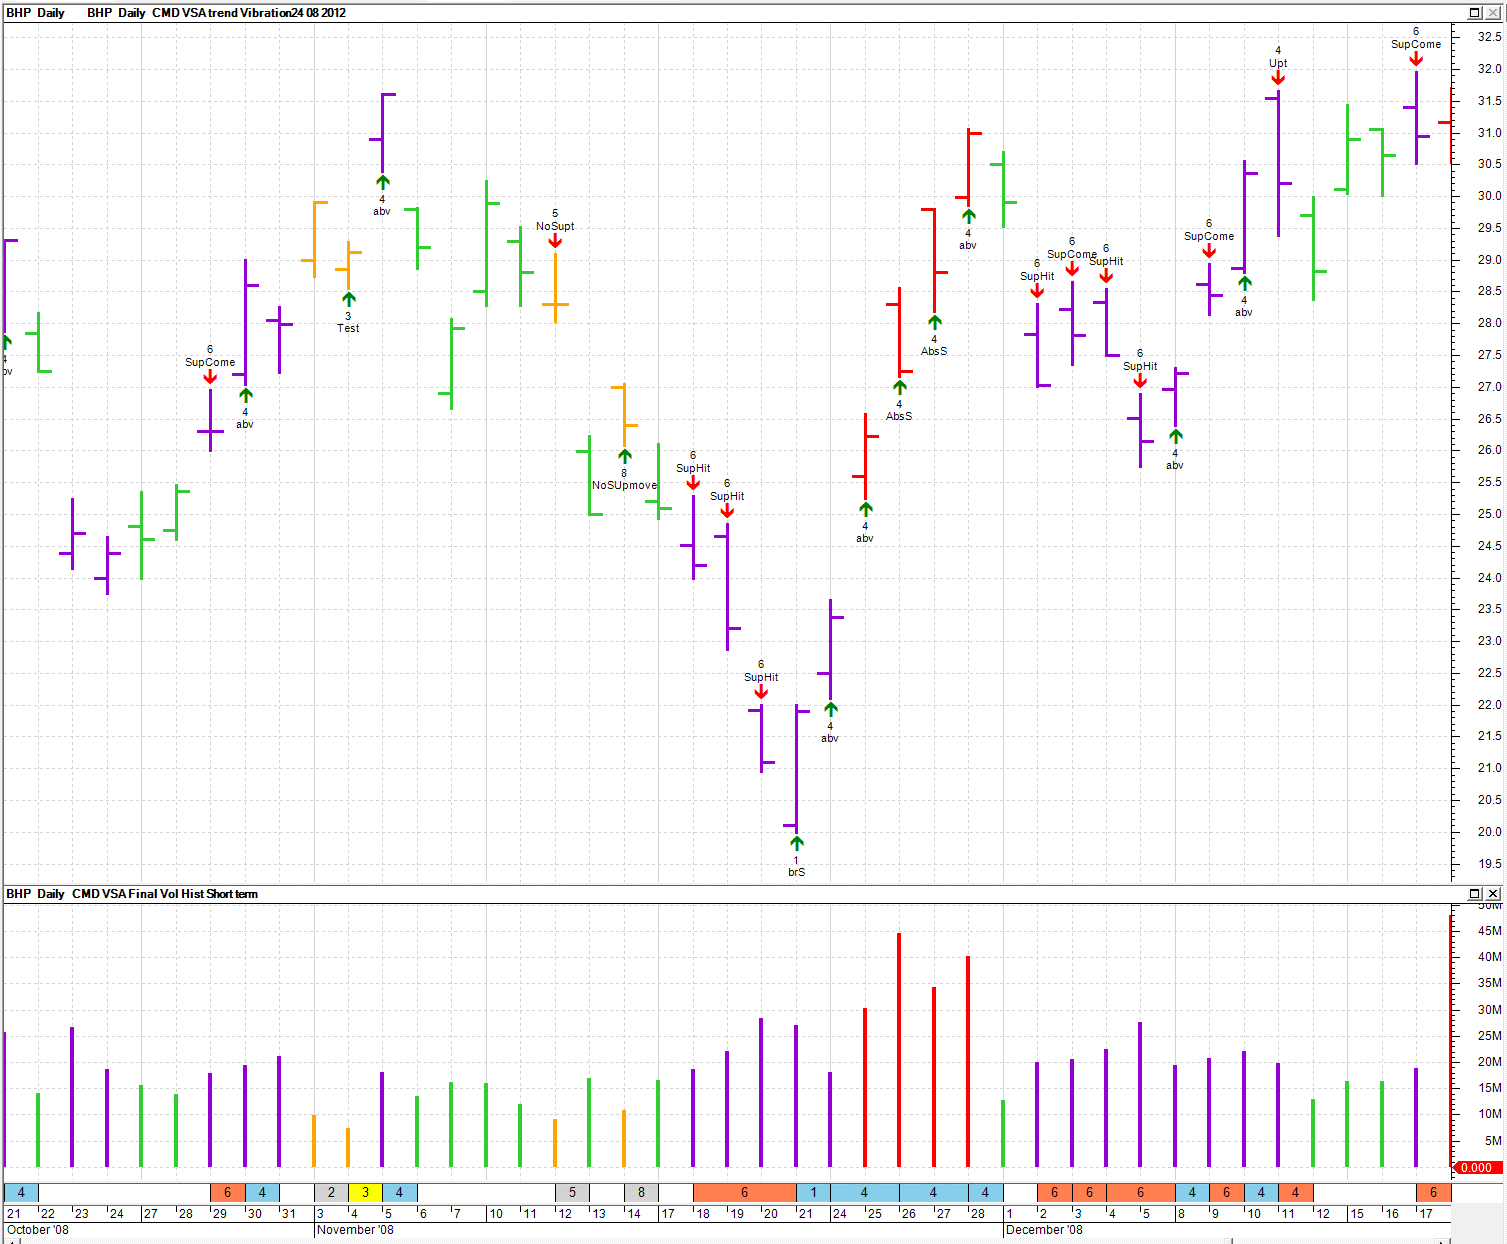 |
|
|
BC User since June 2007
|
|
 |
|
cmacdon 
BullCharts Guru 
Joined: 09 Sep 2012 Location: Brisbane Posts: 236 |
 Post Options Post Options
 Quote Quote  Reply Reply
 Posted: 17 Sep 2012 at 1:31pm Posted: 17 Sep 2012 at 1:31pm |
|
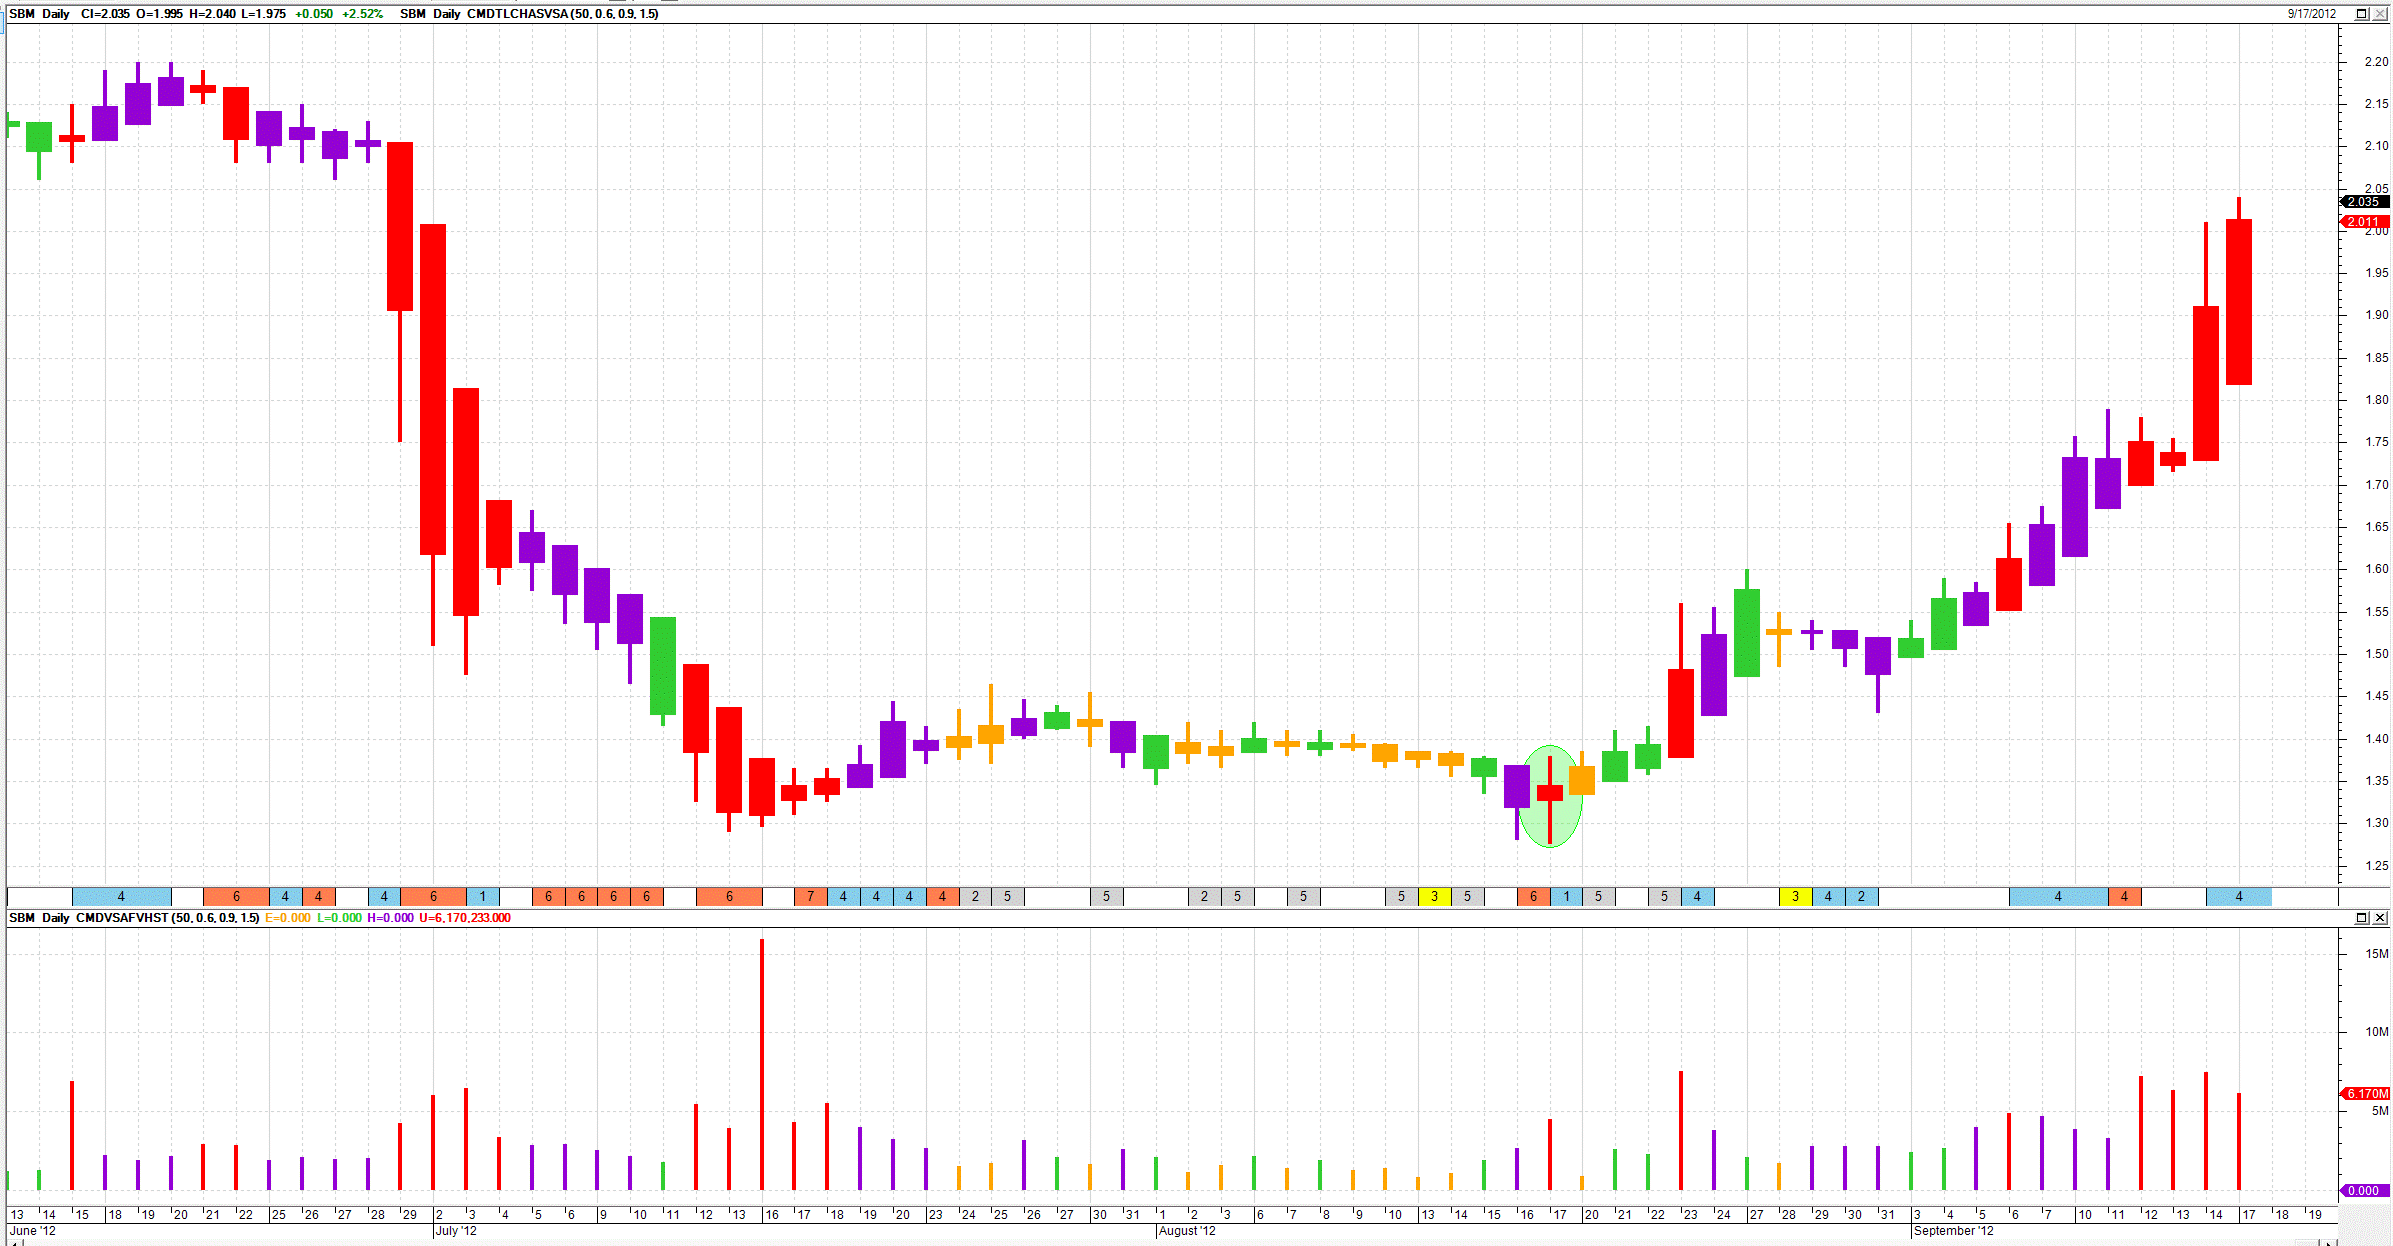
Following on from colouring Heikin Ashi bars posts, here is a Heikin Ashi coloured bar version of the above VSA Chart with the HA bars coloured according to the relative volume.
|
|
|
BC User since June 2007
|
|
 |
|
cmacdon 
BullCharts Guru 
Joined: 09 Sep 2012 Location: Brisbane Posts: 236 |
 Post Options Post Options
 Quote Quote  Reply Reply
 Posted: 17 Sep 2012 at 2:59pm Posted: 17 Sep 2012 at 2:59pm |
|
Sorry
That was SBM not BHP with coloure HA/VSA Volume bars 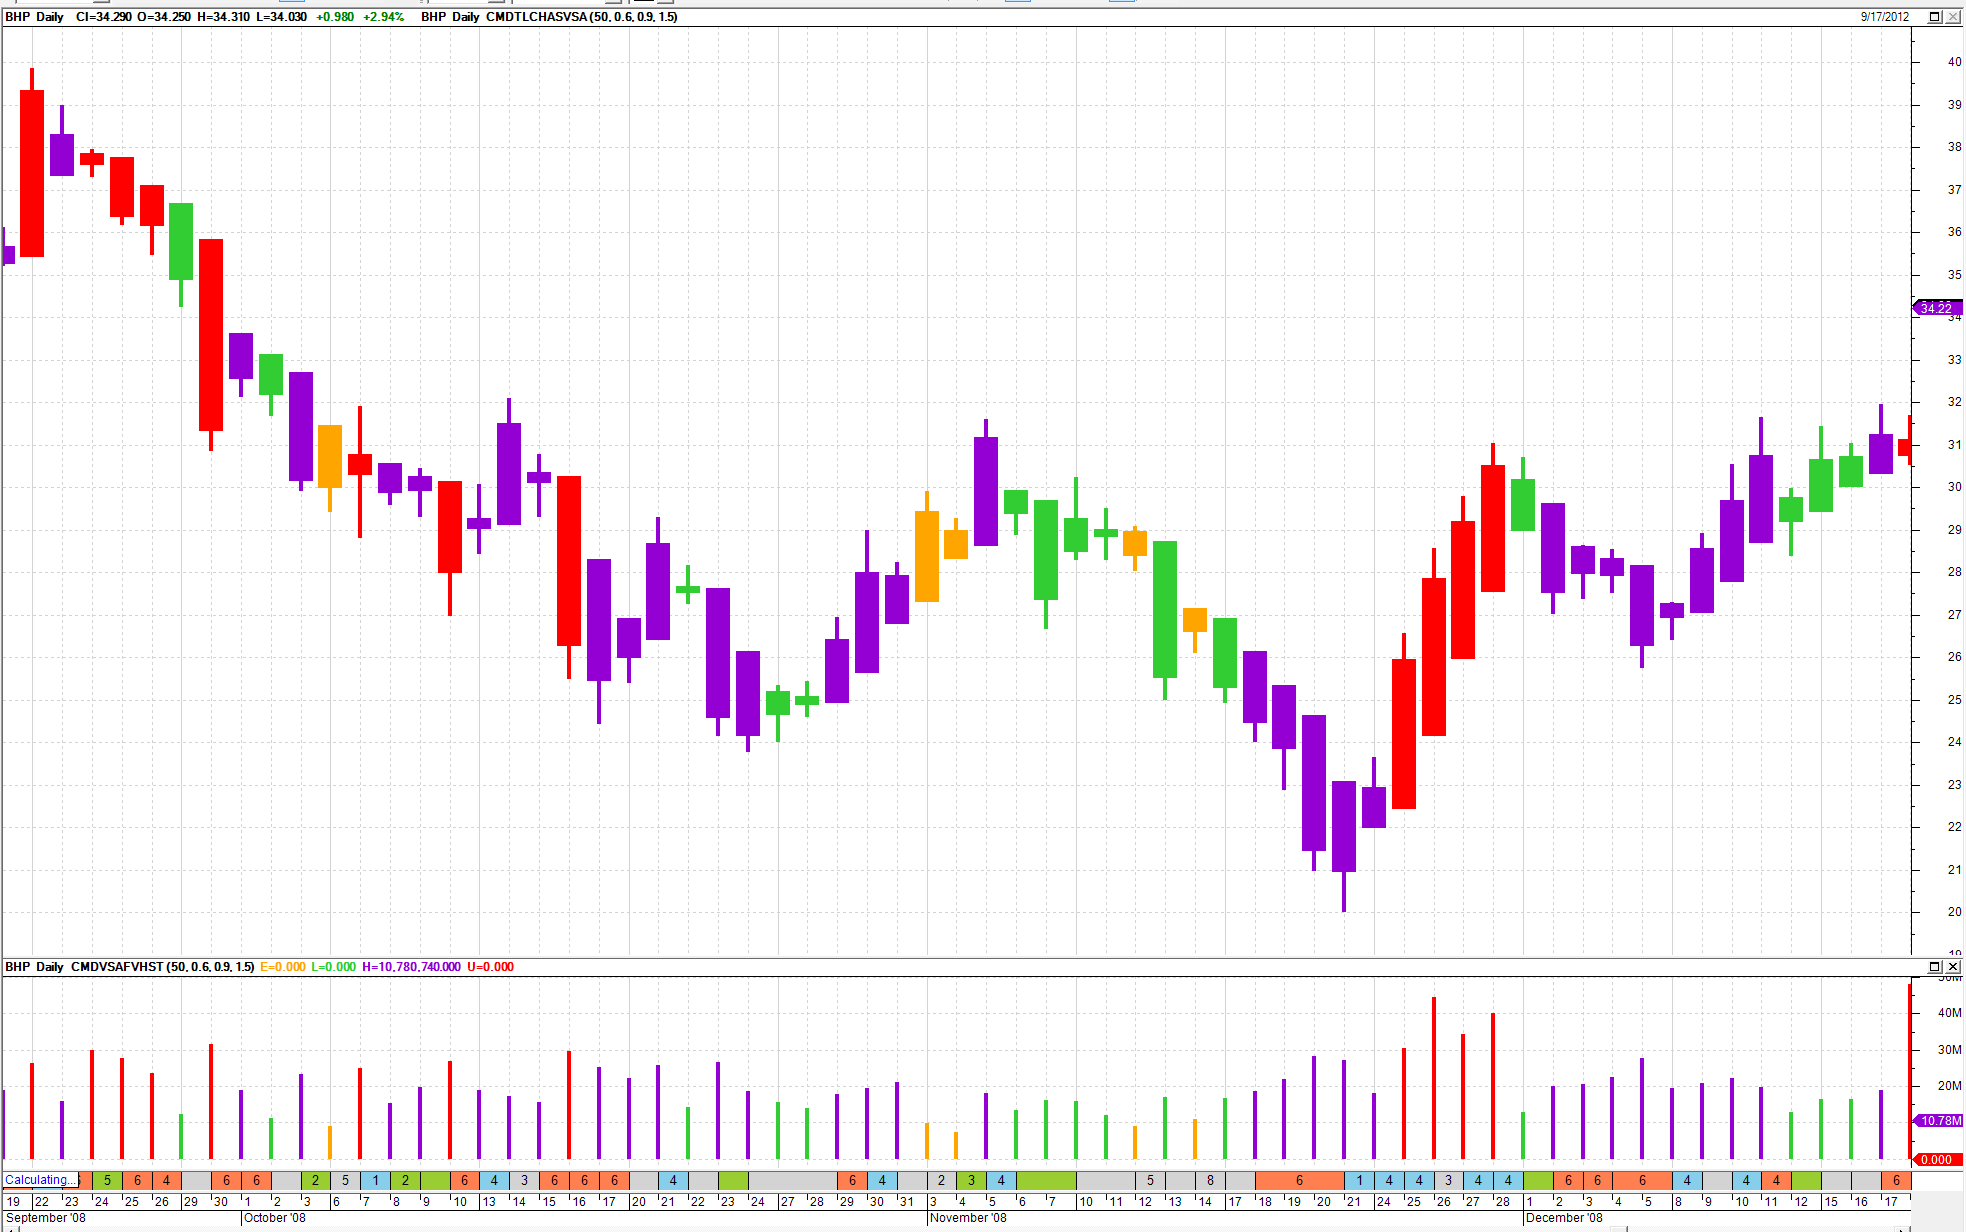 |
|
|
BC User since June 2007
|
|
 |
|
cmacdon 
BullCharts Guru 
Joined: 09 Sep 2012 Location: Brisbane Posts: 236 |
 Post Options Post Options
 Quote Quote  Reply Reply
 Posted: 17 Sep 2012 at 7:18pm Posted: 17 Sep 2012 at 7:18pm |
|
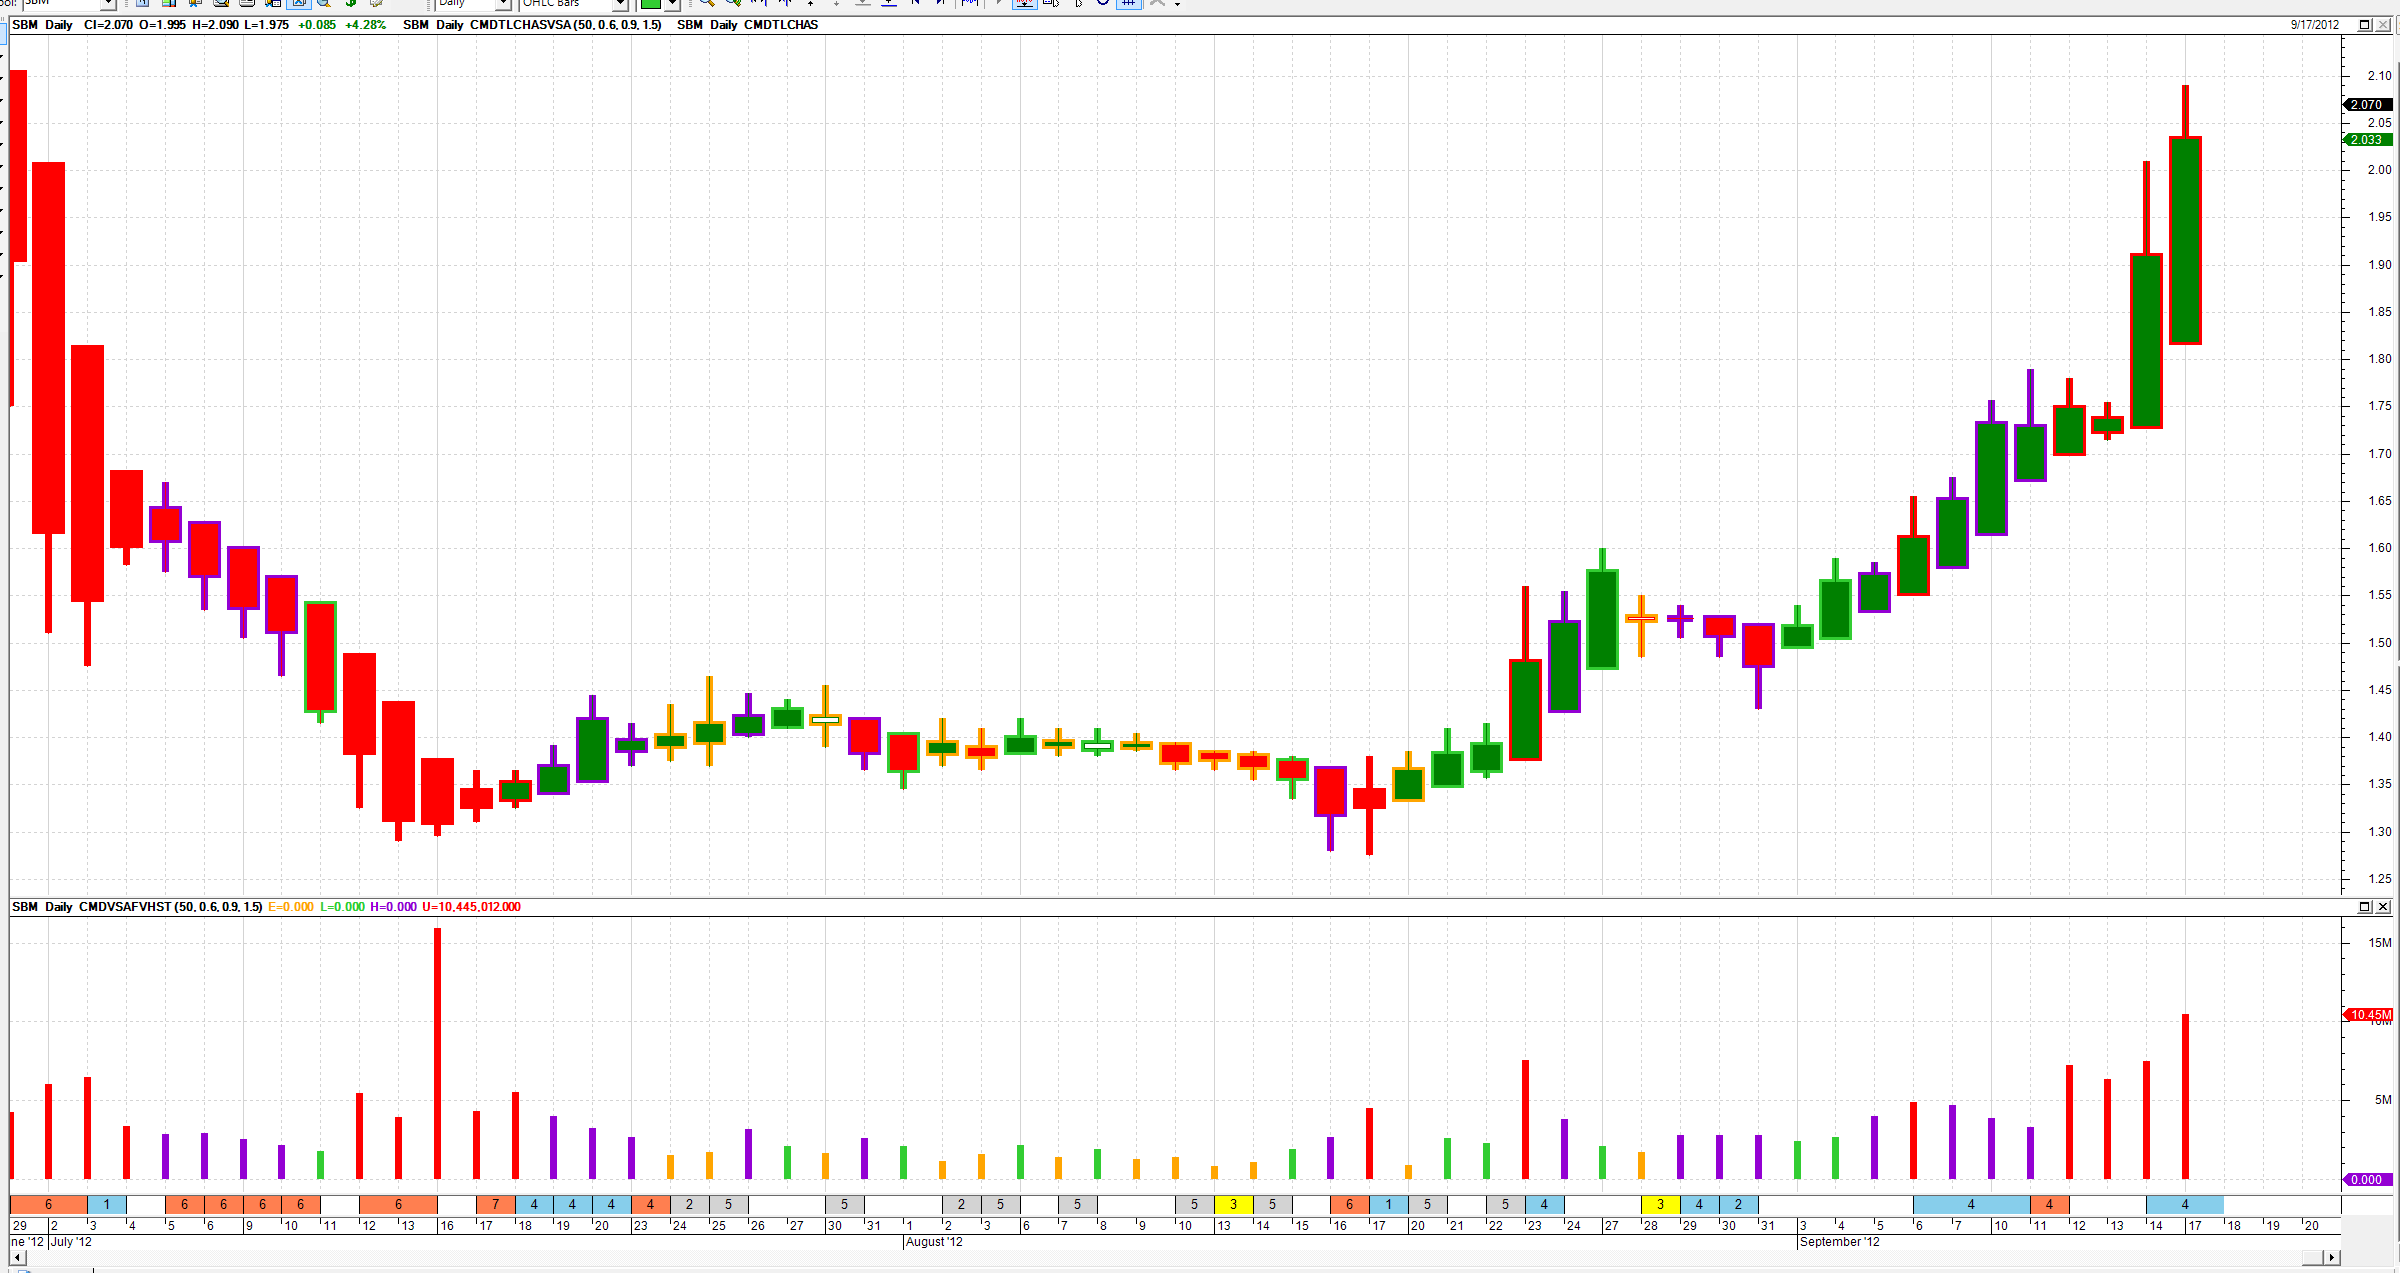
Here is a neat fusion. Puttimg the VSA coloure Heikin Ashi bars on first then opening the green up and red down HA solid couour inidcator gives a chart where the Heikin Ashi trend bars are shown in the colour of the solid body of the HA bars, and the VSA relative Volume colours appear as the colour of the tails or the body outline; so, provides best of both worlds.
 |
|
|
BC User since June 2007
|
|
 |
|
jazza 
Regular 
Joined: 10 Aug 2007 Posts: 33 |
 Post Options Post Options
 Quote Quote  Reply Reply
 Posted: 19 Sep 2012 at 1:27am Posted: 19 Sep 2012 at 1:27am |
|
Hi Cmacdon, Wow, a wealth of information contained in your VSA posts. Great info on Wyckoff and Williams and some serious coding there! I have made a template from your formulas supplied. Great top and bottom reversal signals. How easy/difficult would it be to construct a Bullscan of the reversal signals?
|
|
 |
|
cmacdon 
BullCharts Guru 
Joined: 09 Sep 2012 Location: Brisbane Posts: 236 |
 Post Options Post Options
 Quote Quote  Reply Reply
 Posted: 19 Sep 2012 at 8:35am Posted: 19 Sep 2012 at 8:35am |
|
Jazza
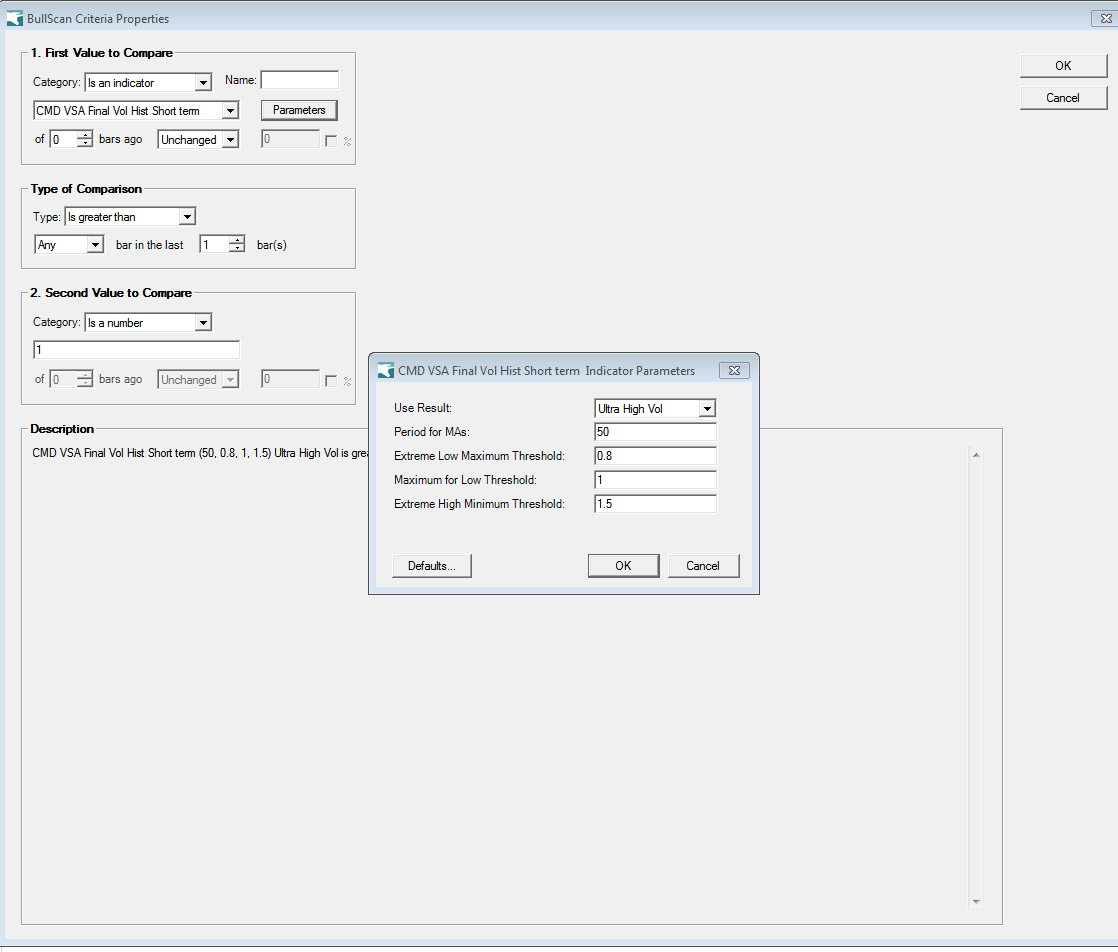
The scans are easy you then just use select Indicator signal. See two scan pictures below . If I have posted them in the right order, The first is selecting a particular VSA signal from the main indicator - in t5his case Bottom reversal with Supply present. The second uses scan on the VSA coloured volume indicator to find stocks with ultrahighvol . 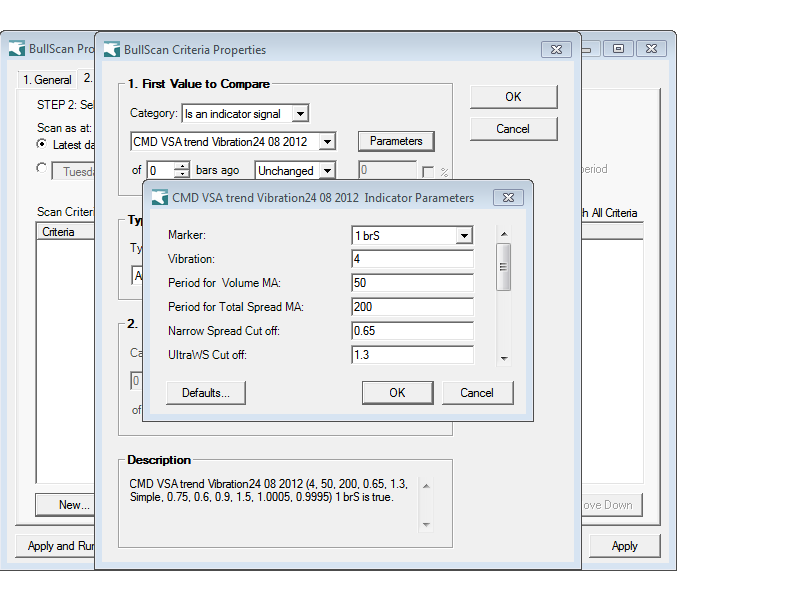 |
|
|
BC User since June 2007
|
|
 |
|
cmacdon 
BullCharts Guru 
Joined: 09 Sep 2012 Location: Brisbane Posts: 236 |
 Post Options Post Options
 Quote Quote  Reply Reply
 Posted: 19 Sep 2012 at 8:37am Posted: 19 Sep 2012 at 8:37am |
|
Obviously the post boxes doesn't accept two pictures posted together. Here is the Vol scan example.
 |
|
|
BC User since June 2007
|
|
 |
|
Post Reply 
|
Page 12> |
| Forum Jump | Forum Permissions  You cannot post new topics in this forum You cannot reply to topics in this forum You cannot delete your posts in this forum You cannot edit your posts in this forum You cannot create polls in this forum You cannot vote in polls in this forum |