Class A divergence |
Post Reply 
|
Page <12 |
| Author |
 Printable Version Printable Version Delicious Delicious Digg Digg Facebook Facebook Furl Furl Google Boomarks Google Boomarks Google Buzz Google Buzz MySpace MySpace Newsvine Newsvine reddit reddit StumbleUpon Translate StumbleUpon Translate Twitter Twitter Windows Live Windows Live Yahoo Bookmarks Yahoo Bookmarks Topic Search Topic Search  Topic Options Topic Options
|
maximo 
BullCharts Guru 

Joined: 02 Sep 2006 Location: Australia Posts: 232 |
 Post Options Post Options
 Quote Reply Quote Reply
 Posted: 23 Dec 2009 at 10:53pm Posted: 23 Dec 2009 at 10:53pm |
|
Hi,
I'm not so sure that it would make it much faster, though give it a try and let me know.
[Description ="Bullish & Bearish Divergence, Max"]d := InputDate("Start Date", date(2009,2,10));start:= BarsSince(OnOrSkipped(d));ind:= Input("MACD=1, RSI=2, STOC=3",3,1);pds:= Input("indicator periods",5,1);Ch:= Input("peak/trough depth minimum (0-100%)",0,0)/100;MD := if(start,macd()-ma(macd(),9,E), prev(undefined));DSI := if(start,ma((ma(C - llv(L,pds),pds,E) / ma(hhv(H,pds) - llv(L,pds),pds,E))*100,2,E), prev(undefined));y:= if(start,If(ind=1,MD,If(ind=2,RSI(C,pds),DSI)), prev(undefined)); { detect indicator peak }Pky:=y< Ref(y,-1) AND Ref(y,-1)>Ref(y,-2) AND Ref(y,-1)>=(y+Ref(y,-2))/2*(1+Ch);Pky1:= ValueWhen(1,Pky,Ref(y,-1));Pky2:= ValueWhen(2,Pky,Ref(y,-1));{ save corresponding price bar peak } Pkx1:= ValueWhen(1,Pky,Ref(C,-1));Pkx2:= ValueWhen(2,Pky,Ref(C,-1));{ detect indicator trough } Try:=y> Ref(y,-1) AND Ref(y,-1)<Ref(y,-2) AND Ref(y,-1)<=(y+Ref(y,-2))/2*(1-Ch);Try1:= ValueWhen(1,Try,Ref(y,-1));Try2:= ValueWhen(2,Try,Ref(y,-1));{ save corresponding price bar trough } Trx1:= ValueWhen(1,Try,Ref(C,-1));Trx2:= ValueWhen(2,Try,Ref(C,-1));y; [linestyle =marker; marker=type1; name=Bull_Div](Try AND Trx1<Trx2 AND Try1>Try2);[linestyle =marker; marker=type2; name=Bear_Div](Pky AND Pkx1>Pkx2 AND Pky1<Pky2);Edited by maximo - 23 Dec 2009 at 11:02pm |
|
 |
|
|
hektorgsd
Newbie 
Joined: 21 Dec 2009 Posts: 2 |
Post Options
Quote Reply
Posted: 24 Dec 2009 at 4:28pm |
|
Hi Maximo, That really makes it quicker. I really appreciate your help
The new formula does not have DMI? Could you please help with the script with the DMI divergence with the start time option? I like having the four to compare!
Merry Xmas
H.
|
|
|
|
|
maximo
BullCharts Guru
Joined: 02 Sep 2006 Location: Australia Posts: 232 |
Post Options
Quote Reply
Posted: 25 Dec 2009 at 2:01am |
|
Okay I've added DMI. Good to hear it's faster. [Description="Bullish & Bearish Divergence, Max"]
d := InputDate("Start Date", date(2009,2,10));start:= BarsSince(OnOrSkipped(d));ind:= Input("MACD=1, RSI=2, STOC=3, DMI=4",1,1);pds:= Input("indicator periods",5,1);Ch:= Input("peak/trough depth minimum (0-100%)",0,0)/100;MD := if(start,macd()-ma(macd(),9,E), prev(undefined));DSI := if(start,ma((ma(C - llv(L,pds),pds,E) / ma(hhv(H,pds) - llv(L,pds),pds,E))*100,2,E), prev(undefined));y:= if(start, If(ind=1,MD, If(ind=2,RSI(C,pds), If(ind=3,DSI, DX(pds)))), prev(undefined)); { detect indicator peak }Pky:=y< Ref(y,-1) AND Ref(y,-1)>Ref(y,-2) AND Ref(y,-1)>=(y+Ref(y,-2))/2*(1+Ch);Pky1:= ValueWhen(1,Pky,Ref(y,-1));Pky2:= ValueWhen(2,Pky,Ref(y,-1));{ save corresponding price bar peak } Pkx1:= ValueWhen(1,Pky,Ref(C,-1));Pkx2:= ValueWhen(2,Pky,Ref(C,-1));{ detect indicator trough } Try:=y> Ref(y,-1) AND Ref(y,-1)<Ref(y,-2) AND Ref(y,-1)<=(y+Ref(y,-2))/2*(1-Ch);Try1:= ValueWhen(1,Try,Ref(y,-1));Try2:= ValueWhen(2,Try,Ref(y,-1));{ save corresponding price bar trough } Trx1:= ValueWhen(1,Try,Ref(C,-1));Trx2:= ValueWhen(2,Try,Ref(C,-1));y; [linestyle =marker; marker=type1; name=Bull_Div](Try AND Trx1<Trx2 AND Try1>Try2);[linestyle =marker; marker=type2; name=Bear_Div](Pky AND Pkx1>Pkx2 AND Pky1<Pky2);¸.·°¯°·.¸¸.-> Merry Christmas <-.¸¸.·°¯°·.¸
|
|
|
|
|
sonu panwar
Newbie

Joined: 27 Feb 2010 Location: india Posts: 5 |
Post Options
Quote Reply
Posted: 27 Feb 2010 at 5:04pm |
|
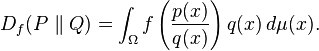
Let P and Q be two probability distributions over a space Ω such that P is absolutely continuous with respect to Q. Then, for a convex function f such that f(1) = 0, the f-divergence of Q from P is If P and Q are both absolutely continuous with respect to a reference distribution μ on Ω then their probability densities p and q satisfy dP = p dμ and dQ = q dμ. In this case the f-divergence can be written as Instances of f-divergences |
|
|
|
|
Post Reply
|
Page <12 |
| Forum Jump | Forum Permissions You cannot post new topics in this forum You cannot reply to topics in this forum You cannot delete your posts in this forum You cannot edit your posts in this forum You cannot create polls in this forum You cannot vote in polls in this forum |