Class A divergence
Printed From: BullCharts Forum
Category: BullCharts
Forum Name: BullScript
Forum Discription: Technical discussion related specifically to the BullScript programming language.
URL: http://www.bullcharts.com.au/forum/forum_posts.asp?TID=556
Printed Date: 29 Jul 2026 at 2:23pm
Software Version: Web Wiz Forums 9.69 - http://www.webwizforums.com
Topic: Class A divergence
Posted By: Bana
Subject: Class A divergence
Date Posted: 11 Apr 2009 at 9:38am
|
Divergences are very powerful signals. Apparently there is a formula in Metastock to search for these. It would be worth testing if it can be converted to bullscript. Any help will be greatly appreciated. thanks Class A price/indicator divergence v3 }{ +1 signal = bullish trough divergences }{ -1 signal = bearish peak divergences }{ ©Copyright 2003 Jose Silva }{ josesilva22@yahoo.com } ind:=Input("MACD=1, RSI=2, DMI=3, Mom=4",1,4,1); pds:=Input("indicator periods",2,2520,10); f:=Input("price field: Close=1, High/Low=2",1,2,1); Ch:=Input("peak/trough depth minimum (0-100%)",0,100,0)/100; shift:=Input("shift signals back to match divergences=1",0,1,0); {y:=insert any indicator or Fml("formula name")} y:=If(ind=1,MACD(),If(ind=2,RSI(C,pds), If(ind=3,DMI(C),Mo(C,pds)))); xu:=If(f=1,C,H); xd:=If(f=1,C,L); Pkx:=xu<Ref(xu,-1) AND Ref(xu,-1)>Ref(xu,-2) AND Ref(xu,-1)>=(xu+Ref(xu,-2))/2*(1+Ch); Pkx1:=ValueWhen(1,Pkx,Ref(xu,-1)); Pkx2:=ValueWhen(2,Pkx,Ref(xu,-1)); Trx:=xd>Ref(xd,-1) AND Ref(xd,-1)<Ref(xd,-2) AND Ref(xd,-1)<=(xd+Ref(xd,-2))/2*(1-Ch); Trx1:=ValueWhen(1,Trx,Ref(xd,-1)); Trx2:=ValueWhen(2,Trx,Ref(xd,-1)); Pky:=y<Ref(y,-1) AND Ref(y,-1)>Ref(y,-2) AND Ref(y,-1)>=(y+Ref(y,-2))/2*(1+Ch); Pky1:=ValueWhen(1,Pky,Ref(y,-1)); Pky2:=ValueWhen(2,Pky,Ref(y,-1)); Try:=y>Ref(y,-1) AND Ref(y,-1)<Ref(y,-2) AND Ref(y,-1)<=(y+Ref(y,-2))/2*(1-Ch); Try1:=ValueWhen(1,Try,Ref(y,-1)); Try2:=ValueWhen(2,Try,Ref(y,-1)); 0; Ref(Trx AND Try AND Trx1<Trx2 AND Try1>Try2,shift) -Ref((Pkx AND Pky AND Pkx1>Pkx2 AND Pky1<Pky2),shift) |
Replies:
Posted By: maximo
Date Posted: 12 Apr 2009 at 12:47am
|
Gives interesting signals on XJO, have fun testing. {Class A price/indicator divergence v3 }{ +1 signal = bullish trough divergences }{ -1 signal = bearish peak divergences }{ ©Copyright 2003 Jose Silva }{ josesilva22@yahoo.com } ind:= Input("MACD=1, RSI=2, DMI=3, Mom=4",2,1);pds:= Input("indicator periods",10,1);f:= Input("price field: Close=1, High/Low=2",1,1);Ch:= Input("peak/trough depth minimum (0-100%)",0,0)/100;shift:= Input("shift signals back to match divergences=1",0,0);{ y:=insert any indicator or Fml("formula name") } y:= If(ind=1,MACD(),If(ind=2,RSI(C,pds),If(ind=3,DX(pds),Mo(C,pds))));xu:= If(f=1,C,H);xd:= If(f=1,C,L);Pkx:=xu< Ref(xu,-1) AND Ref(xu,-1)>Ref(xu,-2) AND Ref(xu,-1)>=(xu+Ref(xu,-2))/2*(1+Ch);Pkx1:= ValueWhen(1,Pkx,Ref(xu,-1));Pkx2:= ValueWhen(2,Pkx,Ref(xu,-1));Trx:=xd> Ref(xd,-1) AND Ref(xd,-1)<Ref(xd,-2) AND Ref(xd,-1)<=(xd+Ref(xd,-2))/2*(1-Ch);Trx1:= ValueWhen(1,Trx,Ref(xd,-1));Trx2:= ValueWhen(2,Trx,Ref(xd,-1));Pky:=y< Ref(y,-1) AND Ref(y,-1)>Ref(y,-2) AND Ref(y,-1)>=(y+Ref(y,-2))/2*(1+Ch);Pky1:= ValueWhen(1,Pky,Ref(y,-1));Pky2:= ValueWhen(2,Pky,Ref(y,-1));Try:=y> Ref(y,-1) AND Ref(y,-1)<Ref(y,-2) AND Ref(y,-1)<=(y+Ref(y,-2))/2*(1-Ch);Try1:= ValueWhen(1,Try,Ref(y,-1));Try2:= ValueWhen(2,Try,Ref(y,-1));0; Ref (Trx AND Try AND Trx1<Trx2 AND Try1>Try2,shift)-Ref((Pkx AND Pky AND Pkx1>Pkx2 AND Pky1<Pky2),shift) |
Posted By: Bana
Date Posted: 12 Apr 2009 at 4:50pm
| thanks Maximo. Will give it a go and put feedback here later on. |
Posted By: maximo
Date Posted: 25 Apr 2009 at 11:46pm
|
Hi Bana,
I had a good look at this indicator and have reconstructed the code for a few reasons.
1. It didn't sync the indicator peaks with the price on the very bar the peak occurs. This results in an occasional mismatch so
indicating divergence when there wasn't any. This sync is also called correct correspondence.
2. Binary indicators aren't very user friendly.. like which spike means what again?
3. Also didn't show the actual indicator being used, which would be good to see.
I have added the MACD difference (histogram line) and Stochastic Momentum.
You can now compare divergences on multiple indicators and see if they match.
Enjoy!
[Description ="Bullish & Bearish Divergence, Max"]ind:= Input("MACD=1, RSI=2, DMI=3, STOC=4",4,1);pds:= Input("indicator periods",5,1);Ch:= Input("peak/trough depth minimum (0-100%)",0,0)/100;MD := macd()-ma(macd(),9,E);DS := ma((ma(C - llv(L,pds),pds,E) / ma(hhv(H,pds) - llv(L,pds),pds,E))*100,2,E);y:= If(ind=1,MD,If(ind=2,RSI(C,pds),If(ind=3,DX(pds),DS))); { detect indicator peak }Pky:=y< Ref(y,-1) AND Ref(y,-1)>Ref(y,-2) AND Ref(y,-1)>=(y+Ref(y,-2))/2*(1+Ch);Pky1:= ValueWhen(1,Pky,Ref(y,-1));Pky2:= ValueWhen(2,Pky,Ref(y,-1));{ save corresponding price bar of peak } Pkx1:= ValueWhen(1,Pky,Ref(C,-1));Pkx2:= ValueWhen(2,Pky,Ref(C,-1));{ detect indicator trough } Try:=y> Ref(y,-1) AND Ref(y,-1)<Ref(y,-2) AND Ref(y,-1)<=(y+Ref(y,-2))/2*(1-Ch);Try1:= ValueWhen(1,Try,Ref(y,-1));Try2:= ValueWhen(2,Try,Ref(y,-1));{ save corresponding price bar of trough } Trx1:= ValueWhen(1,Try,Ref(C,-1));Trx2:= ValueWhen(2,Try,Ref(C,-1));y; [linestyle =marker; marker=type1; name=Bull_Div](Try AND Trx1<Trx2 AND Try1>Try2);[linestyle =marker; marker=type2; name=Bear_Div](Pky AND Pkx1>Pkx2 AND Pky1<Pky2); |
Posted By: maximo
Date Posted: 26 Apr 2009 at 1:01am
|
Example of multi-matching.
|

Posted By: jalna
Date Posted: 29 Apr 2009 at 10:24pm
|
Hi Maximo, thanks for all the work on the divergence indicator. Divergence seems to be getting popular especially with EW enthusiasts I downloaded your code but it didn't have the 3 indicators underneath . I am mainly interested in the MACD. It is the same as the Elliott Wave oscillator. The chart you posted up, was that just a demo of what would be happening on the indicator you have written. The indicator appears to be the Stoch Are these very short term divergences too or are the indicators set at their normal periods ? Thanks |
Posted By: maximo
Date Posted: 30 Apr 2009 at 3:38am
|
Hi Jalna,
Just select the number of the indicator you want to display in the settings: 1=MACD the default setting is 4 for the Stochastic and 2=RSI. I set up 3 seperate instances of this with a different number in the indicator select number. The other number is used as the period for the indicator. ie. 5 is the period for the default Stochastic, so you are right about that. This number is a bit small for the RSI, so 10 or 14 for it would be better.
The MACD uses the standard settings.
Traders International sell the Stochastic & Macd indicator with a day trading education package for $7500. That's quite a hefty sum for an education in indicators lol.
Many divergences are short term, like with that day trading mob. As short as a few minutes to days on the daily chart. All depends on your time frame.
|
Posted By: jalna
Date Posted: 02 May 2009 at 10:08pm
| Hi Maximo, what a great bit of code writing. Thanks, its a great indicator. Thanks heaps |
Posted By: Bana
Date Posted: 08 May 2009 at 11:30am
|
thanks Maximo...just saw the further enhancements you had posted. |
Posted By: hektorgsd
Date Posted: 21 Dec 2009 at 12:29pm
| Hi maximo, I have been testing this indicator, looking for multiple confirmations. The only problem is that my PC takes a fair while to calulate the divergences. I use it on daily chart, is it possible to write into the script to say just to work out the bullish and bearish divergences for the last 1 or 2 years ( not 10 years worth of data). I am sure this would make the calulations much faster. Thanks for your help H. |
Posted By: maximo
Date Posted: 23 Dec 2009 at 10:53pm
|
Hi,
I'm not so sure that it would make it much faster, though give it a try and let me know.
[Description ="Bullish & Bearish Divergence, Max"]d := InputDate("Start Date", date(2009,2,10));start:= BarsSince(OnOrSkipped(d));ind:= Input("MACD=1, RSI=2, STOC=3",3,1);pds:= Input("indicator periods",5,1);Ch:= Input("peak/trough depth minimum (0-100%)",0,0)/100;MD := if(start,macd()-ma(macd(),9,E), prev(undefined));DSI := if(start,ma((ma(C - llv(L,pds),pds,E) / ma(hhv(H,pds) - llv(L,pds),pds,E))*100,2,E), prev(undefined));y:= if(start,If(ind=1,MD,If(ind=2,RSI(C,pds),DSI)), prev(undefined)); { detect indicator peak }Pky:=y< Ref(y,-1) AND Ref(y,-1)>Ref(y,-2) AND Ref(y,-1)>=(y+Ref(y,-2))/2*(1+Ch);Pky1:= ValueWhen(1,Pky,Ref(y,-1));Pky2:= ValueWhen(2,Pky,Ref(y,-1));{ save corresponding price bar peak } Pkx1:= ValueWhen(1,Pky,Ref(C,-1));Pkx2:= ValueWhen(2,Pky,Ref(C,-1));{ detect indicator trough } Try:=y> Ref(y,-1) AND Ref(y,-1)<Ref(y,-2) AND Ref(y,-1)<=(y+Ref(y,-2))/2*(1-Ch);Try1:= ValueWhen(1,Try,Ref(y,-1));Try2:= ValueWhen(2,Try,Ref(y,-1));{ save corresponding price bar trough } Trx1:= ValueWhen(1,Try,Ref(C,-1));Trx2:= ValueWhen(2,Try,Ref(C,-1));y; [linestyle =marker; marker=type1; name=Bull_Div](Try AND Trx1<Trx2 AND Try1>Try2);[linestyle =marker; marker=type2; name=Bear_Div](Pky AND Pkx1>Pkx2 AND Pky1<Pky2); |
Posted By: hektorgsd
Date Posted: 24 Dec 2009 at 4:28pm
|
Hi Maximo, That really makes it quicker. I really appreciate your help
The new formula does not have DMI? Could you please help with the script with the DMI divergence with the start time option? I like having the four to compare!
Merry Xmas
H.
|
Posted By: maximo
Date Posted: 25 Dec 2009 at 2:01am
|
Okay I've added DMI. Good to hear it's faster. [Description="Bullish & Bearish Divergence, Max"]
d := InputDate("Start Date", date(2009,2,10));start:= BarsSince(OnOrSkipped(d));ind:= Input("MACD=1, RSI=2, STOC=3, DMI=4",1,1);pds:= Input("indicator periods",5,1);Ch:= Input("peak/trough depth minimum (0-100%)",0,0)/100;MD := if(start,macd()-ma(macd(),9,E), prev(undefined));DSI := if(start,ma((ma(C - llv(L,pds),pds,E) / ma(hhv(H,pds) - llv(L,pds),pds,E))*100,2,E), prev(undefined));y:= if(start, If(ind=1,MD, If(ind=2,RSI(C,pds), If(ind=3,DSI, DX(pds)))), prev(undefined)); { detect indicator peak }Pky:=y< Ref(y,-1) AND Ref(y,-1)>Ref(y,-2) AND Ref(y,-1)>=(y+Ref(y,-2))/2*(1+Ch);Pky1:= ValueWhen(1,Pky,Ref(y,-1));Pky2:= ValueWhen(2,Pky,Ref(y,-1));{ save corresponding price bar peak } Pkx1:= ValueWhen(1,Pky,Ref(C,-1));Pkx2:= ValueWhen(2,Pky,Ref(C,-1));{ detect indicator trough } Try:=y> Ref(y,-1) AND Ref(y,-1)<Ref(y,-2) AND Ref(y,-1)<=(y+Ref(y,-2))/2*(1-Ch);Try1:= ValueWhen(1,Try,Ref(y,-1));Try2:= ValueWhen(2,Try,Ref(y,-1));{ save corresponding price bar trough } Trx1:= ValueWhen(1,Try,Ref(C,-1));Trx2:= ValueWhen(2,Try,Ref(C,-1));y; [linestyle =marker; marker=type1; name=Bull_Div](Try AND Trx1<Trx2 AND Try1>Try2);[linestyle =marker; marker=type2; name=Bear_Div](Pky AND Pkx1>Pkx2 AND Pky1<Pky2);¸.·°¯°·.¸¸.-> Merry Christmas <-.¸¸.·°¯°·.¸
|
Posted By: sonu panwar
Date Posted: 27 Feb 2010 at 5:04pm
|
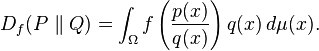
Let P and Q be two probability distributions over a space Ω such that P is http://en.wikipedia.org/wiki/Absolutely_continuous - absolutely continuous with respect to Q. Then, for a http://en.wikipedia.org/wiki/Convex_function - convex function f such that f(1) = 0, the f-divergence of Q from P is If P and Q are both absolutely continuous with respect to a reference distribution μ on Ω then their http://en.wikipedia.org/wiki/Probability_densities - probability densities p and q satisfy dP = p dμ and dQ = q dμ. In this case the f-divergence can be written as Instances of f-divergences------------- http://www.carsteering.com/chrysler_laser_steering_box.htm - chrysler laser steering box |