 |
Add 30EMA to RSC indicator |
Post Reply 
|
| Author | |
Alan 
Newbie 
Joined: 05 Sep 2014 Location: Australia Posts: 8 |
 Post Options Post Options
 Quote Quote  Reply Reply
 Topic: Add 30EMA to RSC indicator Topic: Add 30EMA to RSC indicatorPosted: 06 Sep 2014 at 9:51pm |
|
Hi All,
I'm looking for some help. I would like to add a 30 period EMA moving average to a chart that has 2 panels. In the first panel, I have the stock, CBA in my example with an EMA30 on the chart over price. This is normal and there is no problem with this. Then I add a second panel that shows the RSC (Relative Strength Comparison) of CBA as compared to the XJO. This is the green line shown in the diagram below, in panel 2. Now I want to add a 30 period EMA moving average onto this green RSC line ( blue line in picture below), however in Bullcharts, I'm not able to have the 30EMA calculating based on the RSC line (green line). How can I get the EMA30 to show the 30 period average of the RSC line? Do I need a customised indicator for this, or is there a built in standard indicator in Bullcharts that I can use? Here is a picture of what I'm trying to set up. Please note that the blue 30EMA line in the bottom panel is incorrect and just shown for illustration purposes to show what I'm after. Please advise any thoughts or suggestions on how I can overcome this issue. ( This works fine in Metastock). |
|
 |
|
joea 
Newbie 
Joined: 15 Nov 2011 Location: Miallo Posts: 19 |
 Post Options Post Options
 Quote Quote  Reply Reply
 Posted: 07 Sep 2014 at 6:48pm Posted: 07 Sep 2014 at 6:48pm |
|
Alan
I cannot understand why you want a average of RSC line. You would just be getting a average !! However I think you should look at another indicator such as Twiggs Money Flow. However check what this indicator means first. And put it in the same panel as the RSC. Or better ask an opinion on CBA. If you have a code in Metastock, check with the tech guys on Bullcharts. The may convert it. cheers |
|
 |
|
Alan 
Newbie 
Joined: 05 Sep 2014 Location: Australia Posts: 8 |
 Post Options Post Options
 Quote Quote  Reply Reply
 Posted: 08 Sep 2014 at 11:08am Posted: 08 Sep 2014 at 11:08am |
|
Hi Joe,
Thanks for the reply. I used CBA as an example in the query above, however, this analysis is normally only done on GICS sectors, when comparing the sector to the ASX all ords. The object of this review is to compare the strength of the sector to the ASX all ords and see if the individual sector is tracking above or below the All Ords. This concept is discussed on the website http://tradinggame.com.au/current-hot-cold-sectors/ . The analysis provides with a list of hot and cold sectors and could be used to validate or support a decision to go long or short on a particular stock. Hope this makes sense. Cheers
|
|
 |
|
cmacdon 
BullCharts Guru 
Joined: 09 Sep 2012 Location: Brisbane Posts: 236 |
 Post Options Post Options
 Quote Quote  Reply Reply
 Posted: 11 Sep 2014 at 3:16pm Posted: 11 Sep 2014 at 3:16pm |
|
Alan
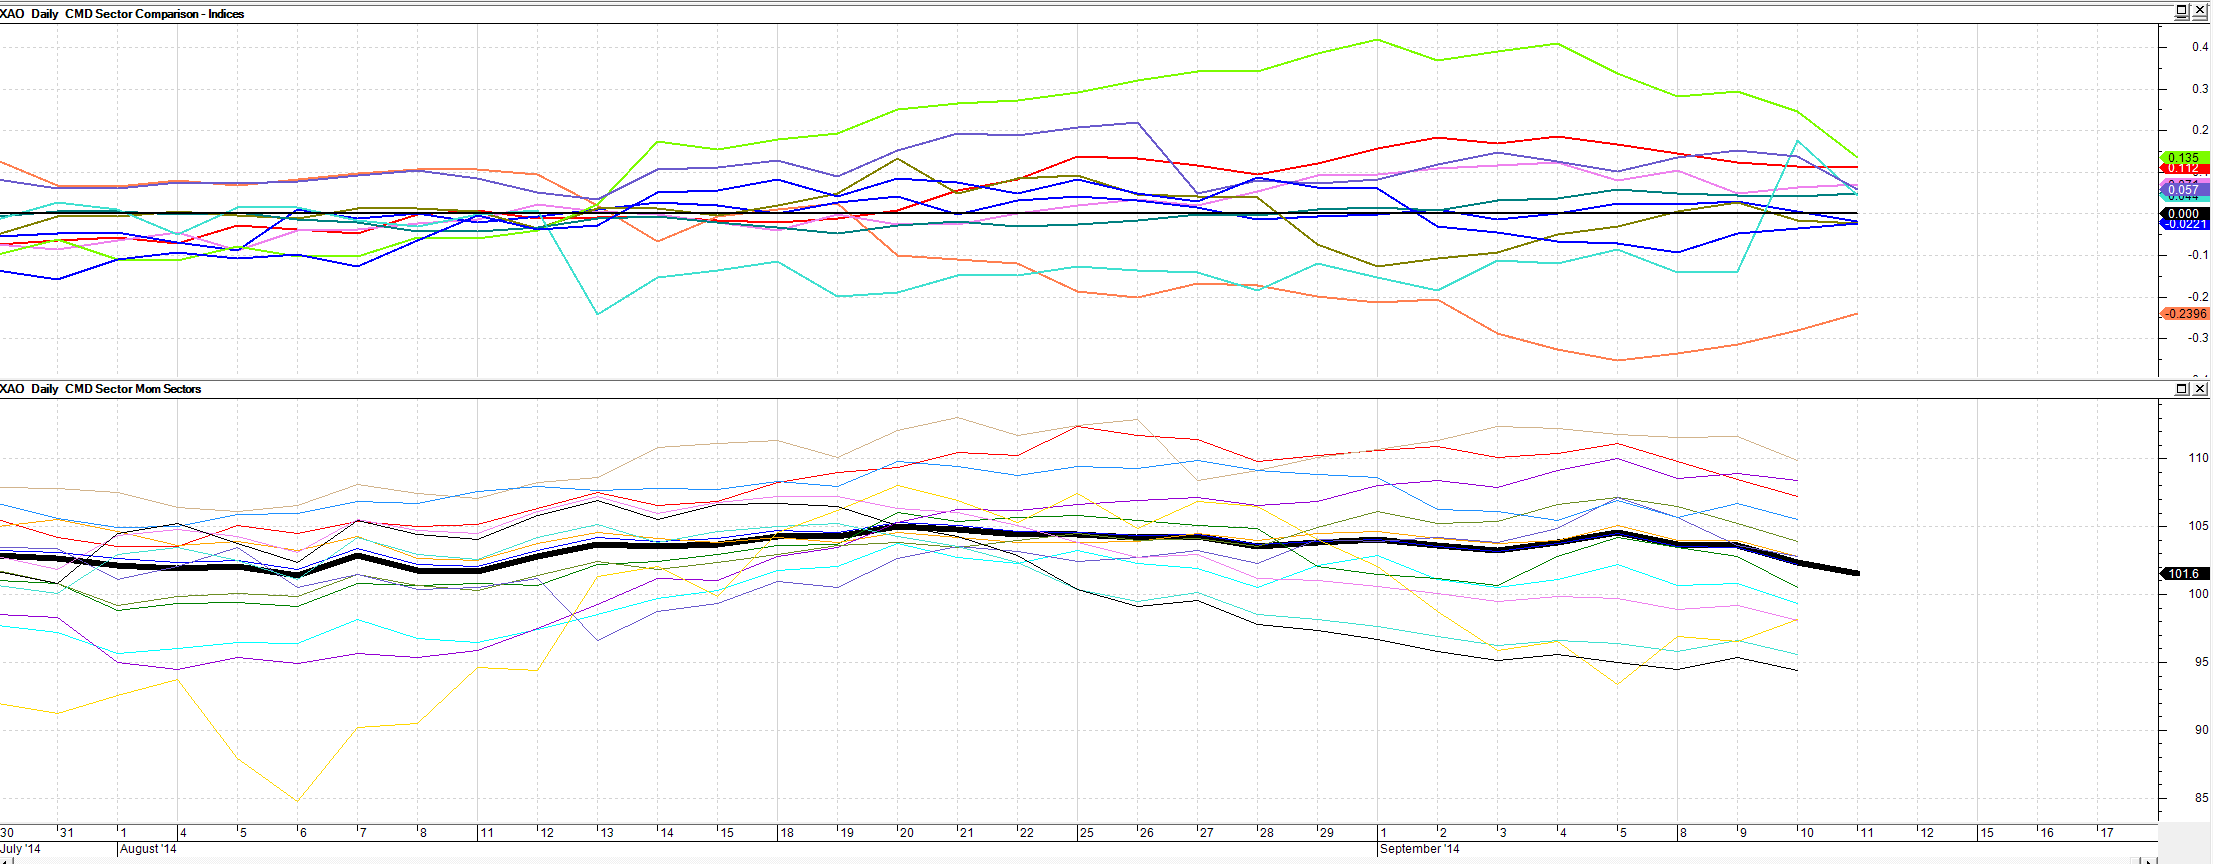
History is repeating. Have a look at some early posts by Maximo on this Forum as he provided good sector analysis code. you can easily adapt to what you want I will post a chart of two slightly different sector analysis indicators the first was derived from Maximo but I would have tailored it to the sectors I was looking at the time. It may be what you are looking for as it is a rate of change indicator. The second is a Momentum version. I also have a Fisher Transform version that I will dig out and check later and if it does not look up the FT via a dll I will post that later Separate code further after charts 
|
|
|
BC User since June 2007
|
|
 |
|
cmacdon 
BullCharts Guru 
Joined: 09 Sep 2012 Location: Brisbane Posts: 236 |
 Post Options Post Options
 Quote Quote  Reply Reply
 Posted: 11 Sep 2014 at 3:17pm Posted: 11 Sep 2014 at 3:17pm |
|
[description="Universal Relative Strength Comparison, Original Author Maximo"]
symb := inputsymbol("ASX 200", "XJO"); period:= input("average period",20,1); sec1 := inputsymbol("Energy", "XEJ"); sec2 := inputsymbol("Materials", "XMJ"); sec3 := inputsymbol("Industrials", "XNJ"); sec4 := inputsymbol("Consumer Discretionary", "XDJ"); sec5 := inputsymbol("Consumer Staples", "XSJ"); sec6 := inputsymbol("Health Care", "XHJ"); sec7 := inputsymbol("Financials", "XFJ"); sec8 := inputsymbol("Information Technology", "XIJ"); sec9 := inputsymbol("Telecommunications", "XTJ"); secA := inputsymbol("Utilities", "XUJ"); secB := inputsymbol("XJO", "XJO"); index:= LoadSymbol(symb,C); sector1:= LoadSymbol(sec1,C); sector2:= LoadSymbol(sec2,C); sector3:= LoadSymbol(sec3,C); sector4:= LoadSymbol(sec4,C); sector5:= LoadSymbol(sec5,C); sector6:= LoadSymbol(sec6,C); sector7:= LoadSymbol(sec7,C); sector8:= LoadSymbol(sec8,C); sector9:= LoadSymbol(sec9,C); sectorA:= LoadSymbol(secA,C); sectorB:= LoadSymbol(secB,C); [name=energy; color =red; width=2] ma (ROC(sector1,1,%),period,S)-ma(ROC(index,1,%),period,S); [name=materials;color =coral] ma (ROC(sector2,1,%),period,S)-ma(ROC(index,1,%),period,S); [name=industrial;color =violet] ma (ROC(sector3,1,%),period,S)-ma(ROC(index,1,%),period,S); [name=consumer distretionary;color =Violet orchid] ma (ROC(sector4,1,%),period,S)-ma(ROC(index,1,%),period,S); [name=consumer staples;color =olive] ma (ROC(sector5,1,%),period,S)-ma(ROC(index,1,%),period,S); [name=health care;color =lawn green] ma (ROC(sector6,1,%),period,S)-ma(ROC(index,1,%),period,S); [name=financials; color =Teal] ma (ROC(sector7,1,%),period,S)-ma(ROC(index,1,%),period,S); [name=it;color =Turquoise] ma (ROC(sector8,1,%),period,S)-ma(ROC(index,1,%),period,S); [name=telecoms;color =Slate Blue] ma (ROC(sector9,1,%),period,S)-ma(ROC(index,1,%),period,S); [name=utilities;color =Blue] ma (ROC(sectorA,1,%),period,S)-ma(ROC(index,1,%),period,S); [name=XJO benchmark;color =Black] ma (ROC(sectorB,1,%),period,S)-ma(ROC(index,1,%),period,S); |
|
|
BC User since June 2007
|
|
 |
|
cmacdon 
BullCharts Guru 
Joined: 09 Sep 2012 Location: Brisbane Posts: 236 |
 Post Options Post Options
 Quote Quote  Reply Reply
 Posted: 11 Sep 2014 at 3:18pm Posted: 11 Sep 2014 at 3:18pm |
|
expr := expression("Expression");
n := input("Time periods",100,1); sec2 := inputsymbol("Indices", "XJO"); sec3 := inputsymbol("Indices", "XDJ"); sec4 := inputsymbol("Indices", "XSJ"); sec5 := inputsymbol("Indices", "XEJ"); sec6 := inputsymbol("Indices", "XFJ"); sec7 := inputsymbol("Indices", "XHJ"); sec8 := inputsymbol("Indices", "XNJ"); sec9 := inputsymbol("Indices", "XIJ"); secA := inputsymbol("Indices", "XMJ"); secB := inputsymbol("Indices", "XJR"); secC := inputsymbol("Indices", "XTJ"); secD := inputsymbol("Indices", "XUJ"); secE := inputsymbol("Indices", "XGD"); secF := inputsymbol("Indices", "XMM"); sector2:=LoadSymbol(sec2,C); sector3:=LoadSymbol(sec3,C); sector4:=LoadSymbol(sec4,C); sector5:=LoadSymbol(sec5,C); sector6:=LoadSymbol(sec6,C); sector7:=LoadSymbol(sec7,C); sector8:=LoadSymbol(sec8,C); sector9:=LoadSymbol(sec9,C); sectorA:=LoadSymbol(secA,C); sectorB:=LoadSymbol(secB,C); sectorC:=LoadSymbol(secC,C); sectorD:=LoadSymbol(secD,C); sectorE:=LoadSymbol(secE,C); sectorF:=LoadSymbol(secF,C); [name="Chart"; color=black; width=6] (c/hist(c,n))*100; [name="XJO";color=blue; width=1] (sector2/hist(sector2,n))*100; [name="XDJ";color=Cyan;] (sector3/hist(sector3,n))*100; [name="XSJ";color=green] (sector4/hist(sector4,n))*100; [name="XEJ";color=red] (sector5/hist(sector5,n))*100; [name="XFJ";color=orange] (sector6/hist(sector6,n))*100; [name="XHJ"; color=Dark Violet] (sector7/hist(sector7,n))*100; [name="XNJ";color=Olive Drab] (sector8/hist(sector8,n))*100; [name="XIJ";color=Slate Blue] (sector9/hist(sector9,n))*100; [name="XMJ";color=Turquoise] (sectorA/hist(sectorA,n))*100; [name="XJR";color=Violet] (sectorB/hist(sectorB,n))*100; [name="XTJ";color=Tan] (sectorC/hist(sectorC,n))*100; [name="XUJ";color=Dodger Blue] (sectorD/hist(sectorD,n))*100; [name="XGD";color=Gold] (sectorE/hist(sectorE,n))*100; [name="XMM";color=Black] (sectorF/hist(sectorF,n))*100; |
|
|
BC User since June 2007
|
|
 |
|
cmacdon 
BullCharts Guru 
Joined: 09 Sep 2012 Location: Brisbane Posts: 236 |
 Post Options Post Options
 Quote Quote  Reply Reply
 Posted: 11 Sep 2014 at 4:09pm Posted: 11 Sep 2014 at 4:09pm |
|
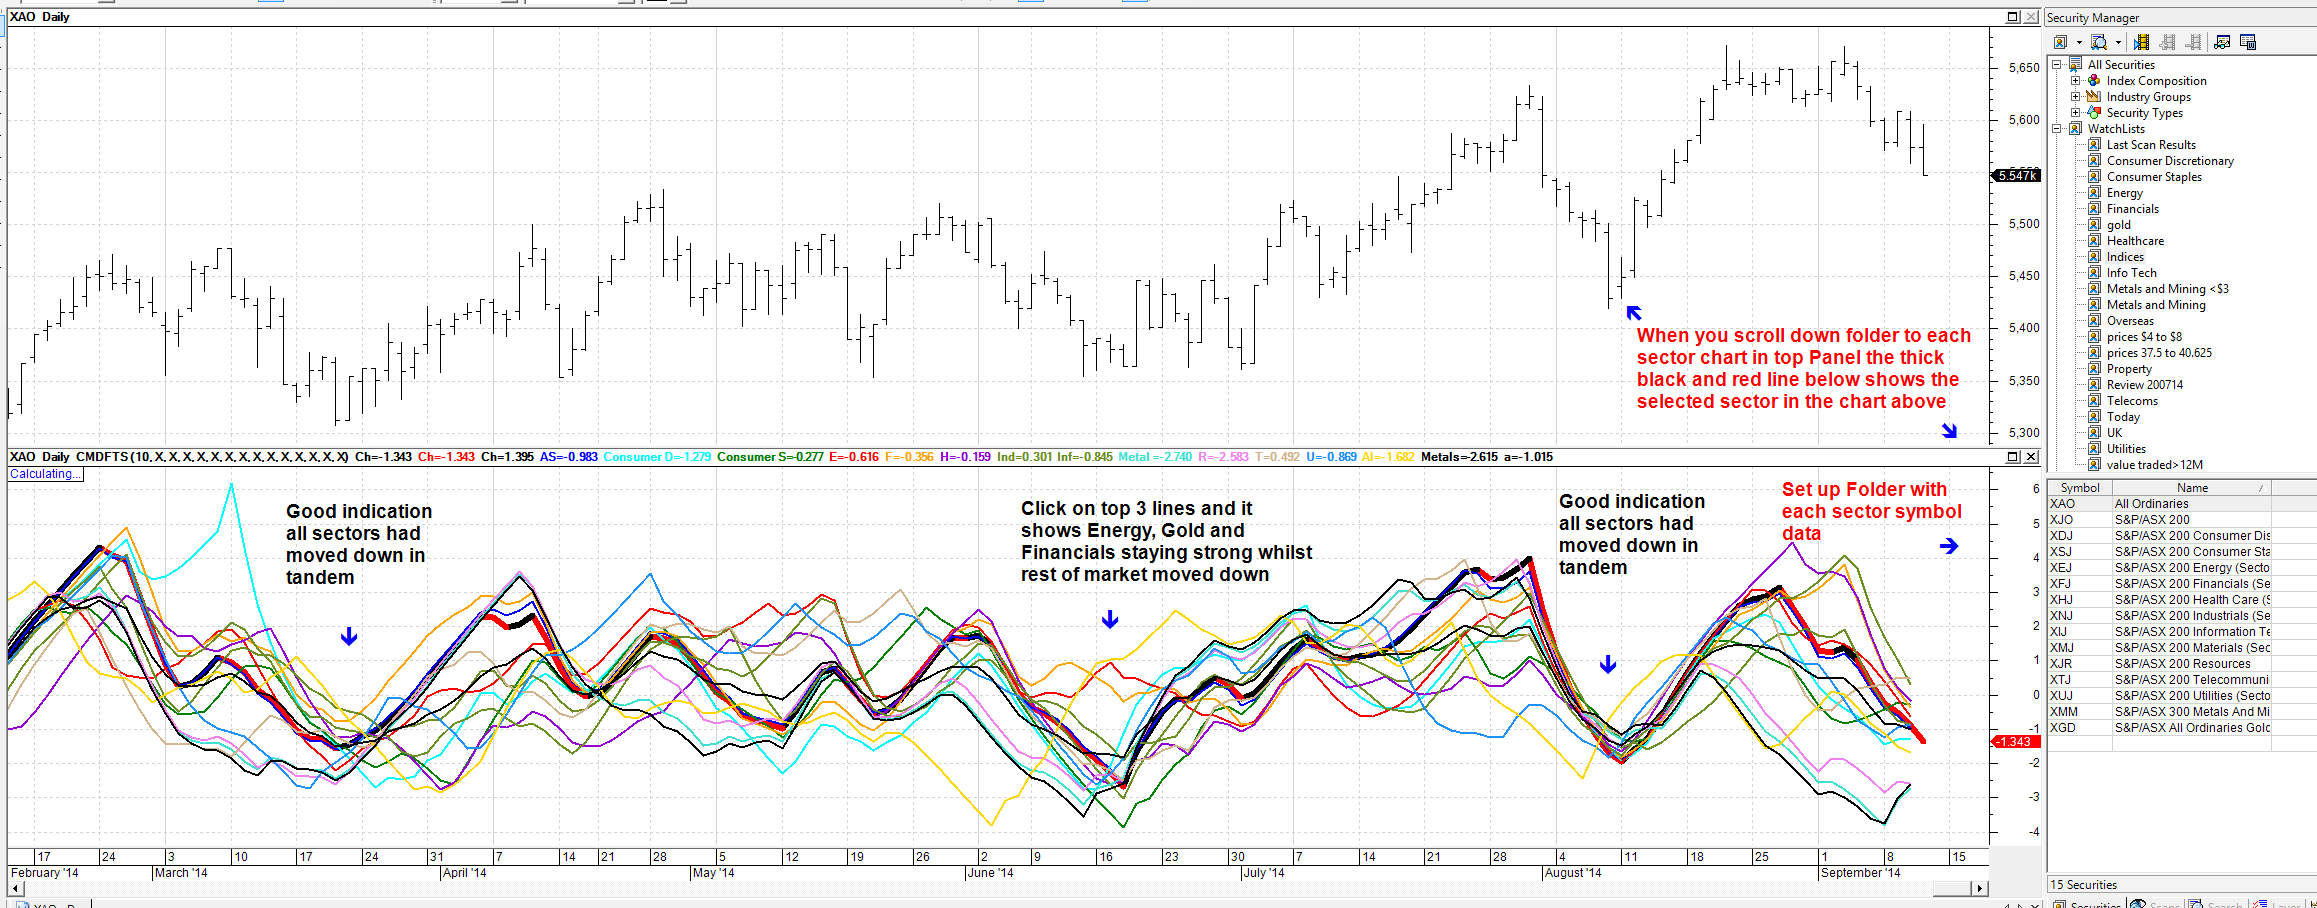
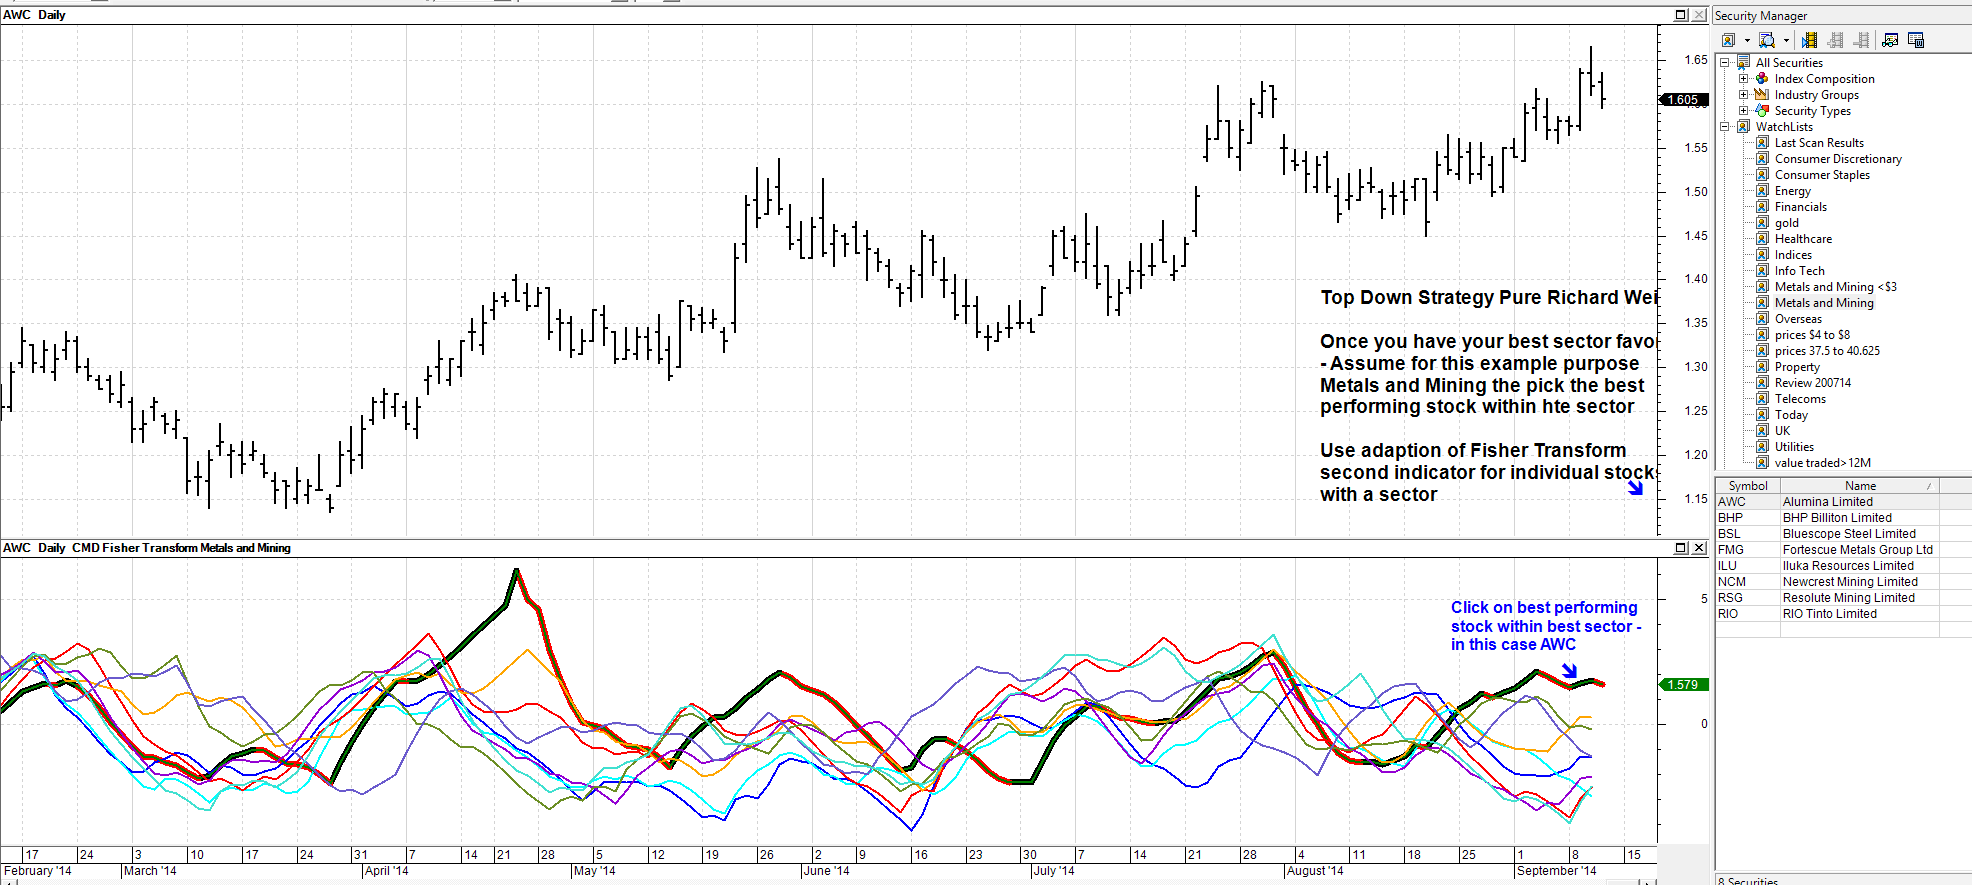
Here is Fisher transform version of a sector analysis which you can use to do a Top Down Strategy Approach as Richard Weikoff suggested.
This involves first performing a best performing sector analysis then look at best performing stock within a sector - so 2 separate indicators coded below one for the sectors and one for stocks within a particular sector for this example say preferred 10 stocks from the Metals and Mining sector. In practice to be methodical, you would need a folder with the symbol data for each sector. Then a folder for the preferred 10 or so stocks you are prepared to trade in within each preferred sector. As previously mentioned I do not do this anymore as you can quickly scroll through the high activity stocks at the top of the ASX 200 fairly quickly. The Weikoff Top Down Strategy might be a good strategy to focus if you were dealing with a much larger exchange like the US. Obviously Richard Weikoff did not know about the Fisher Trasnform so it is his conceptual selection strategy being applied using John Ehlers Fisher Transform. 
 Edited by cmacdon - 11 Sep 2014 at 4:59pm |
|
|
BC User since June 2007
|
|
 |
|
cmacdon 
BullCharts Guru 
Joined: 09 Sep 2012 Location: Brisbane Posts: 236 |
 Post Options Post Options
 Quote Quote  Reply Reply
 Posted: 11 Sep 2014 at 4:12pm Posted: 11 Sep 2014 at 4:12pm |
|
{Again an adaptation from a Maximo sector analysis indicator code from this Forum but I applied a Fisher Transform function for each sector as FT gives good turning points. refer John Ehlers, Cybernetic Analysis for Stocks and Futures John Wiley, 2004"}
[description="Universal Relative Strength Comparison, Max" CMD Adapted to Fisher Transform] prd:= input(" length", 10, 1, 50); sec2 := inputsymbol("Sector", "XJO"); sec3 := inputsymbol("Sector", "XDJ"); sec4 := inputsymbol("Sector", "XSJ"); sec5 := inputsymbol("Sector", "XEJ"); sec6 := inputsymbol("Sector", "XFJ"); sec7 := inputsymbol("Sector", "XHJ"); sec8 := inputsymbol("Sector", "XNJ"); sec9 := inputsymbol("Sector", "XIJ"); secA := inputsymbol("Sector", "XMJ"); secB := inputsymbol("Sector", "XJR"); secC := inputsymbol("Sector", "XTJ"); secD := inputsymbol("Sector", "XUJ"); secE := inputsymbol("Sector", "XGD"); secF := inputsymbol("Sector", "XMM"); sector2:=LoadSymbol(sec2,C); sector3:=LoadSymbol(sec3,C); sector4:=LoadSymbol(sec4,C); sector5:=LoadSymbol(sec5,C); sector6:=LoadSymbol(sec6,C); sector7:=LoadSymbol(sec7,C); sector8:=LoadSymbol(sec8,C); sector9:=LoadSymbol(sec9,C); sectorA:=LoadSymbol(secA,C); sectorB:=LoadSymbol(secB,C); sectorC:=LoadSymbol(secC,C); sectorD:=LoadSymbol(secD,C); sectorE:=LoadSymbol(secE,C); sectorF:=LoadSymbol(secF,C); pr := C; maxh := highest(pr,prd); minl := lowest(pr,prd); val1 := 0.33*2*((pr - minl)/(maxh - minl) - 0.5) + 0.67*previous; value1 := if(val1 > 0.99,0.999,if(val1 < -0.99,-0.999,val1)); fish := 0.5*log((1 + value1)/(1 - value1))+0.5*previous; pr2 := sector2; maxh2 := highest(pr2,prd); minl2 := lowest(pr2,prd); val12 := 0.33*2*((pr2 - minl2)/(maxh2 - minl2) - 0.5) + 0.67*previous; value12 := if(val12 > 0.99,0.999,if(val12 < -0.99,-0.999,val12)); fish2 := 0.5*log((1 + value12)/(1 - value12))+0.5*previous; pr3 := sector3; maxh3 := highest(pr3,prd); minl3 := lowest(pr3,prd); val13 := 0.33*2*((pr3 - minl3)/(maxh3 - minl3) - 0.5) + 0.67*previous; value13 := if(val13 > 0.99,0.999,if(val13 < -0.99,-0.999,val13)); fish3 := 0.5*log((1 + value13)/(1 - value13))+0.5*previous; pr4 := sector4; maxh4 := highest(pr4,prd); minl4 := lowest(pr4,prd); val14 := 0.33*2*((pr4 - minl4)/(maxh4 - minl4) - 0.5) + 0.67*previous; value14 := if(val14 > 0.99,0.999,if(val14 < -0.99,-0.999,val14)); fish4 := 0.5*log((1 + value14)/(1 - value14))+0.5*previous; pr5 := sector5; maxh5 := highest(pr5,prd); minl5 := lowest(pr5,prd); val15 := 0.33*2*((pr5 - minl5)/(maxh5 - minl5) - 0.5) + 0.67*previous; value15 := if(val15 > 0.99,0.999,if(val15 < -0.99,-0.999,val15)); fish5 := 0.5*log((1 + value15)/(1 - value15))+0.5*previous; pr6 := sector6; maxh6 := highest(pr6,prd); minl6 := lowest(pr6,prd); val16 := 0.33*2*((pr6 - minl6)/(maxh6 - minl6) - 0.5) + 0.67*previous; value16 := if(val16 > 0.99,0.999,if(val16 < -0.99,-0.999,val16)); fish6 := 0.5*log((1 + value16)/(1 - value16))+0.5*previous; pr7 := sector7; maxh7 := highest(pr7,prd); minl7 := lowest(pr7,prd); val17 := 0.33*2*((pr7 - minl7)/(maxh7 - minl7) - 0.5) + 0.67*previous; value17 := if(val17 > 0.99,0.999,if(val17 < -0.99,-0.999,val17)); fish7 := 0.5*log((1 + value17)/(1 - value17))+0.5*previous; pr8 := sector8; maxh8 := highest(pr8,prd); minl8 := lowest(pr8,prd); val18 := 0.33*2*((pr8 - minl8)/(maxh8 - minl8) - 0.5) + 0.67*previous; value18 := if(val18 > 0.99,0.999,if(val18 < -0.99,-0.999,val18)); fish8 := 0.5*log((1 + value18)/(1 - value18))+0.5*previous; pr9 := sector9; maxh9 := highest(pr9,prd); minl9 := lowest(pr9,prd); val19 := 0.33*2*((pr9 - minl9)/(maxh9 - minl9) - 0.5) + 0.67*previous; value19 := if(val19 > 0.99,0.999,if(val19 < -0.99,-0.999,val19)); fish9 := 0.5*log((1 + value19)/(1 - value19))+0.5*previous; prA := sectora; maxhA := highest(prA,prd); minlA := lowest(prA,prd); val1A := 0.33*2*((prA - minlA)/(maxhA - minlA) - 0.5) + 0.67*previous; value1A := if(val1A > 0.99,0.999,if(val1A < -0.99,-0.999,val1A)); fishA := 0.5*log((1 + value1A)/(1 - value1A))+0.5*previous; prB := sectorB; maxhB := highest(prB,prd); minlB := lowest(prB,prd); val1B := 0.33*2*((prB - minlB)/(maxhB - minlB) - 0.5) + 0.67*previous; value1B := if(val1B > 0.99,0.999,if(val1B < -0.99,-0.999,val1B)); fishB := 0.5*log((1 + value1B)/(1 - value1B))+0.5*previous; prC := sectorC; maxhC := highest(prC,prd); minlC := lowest(prC,prd); val1C := 0.33*2*((prC - minlC)/(maxhC - minlC) - 0.5) + 0.67*previous; value1C := if(val1C > 0.99,0.999,if(val1C < -0.99,-0.999,val1C)); fishC := 0.5*log((1 + value1C)/(1 - value1C))+0.5*previous; prD2 := sectorD; maxhD := highest(prD2,prd); minlD := lowest(prD2,prd); val1D := 0.33*2*((prD2 - minlD)/(maxhD - minlD) - 0.5) + 0.67*previous; value1D := if(val1D > 0.99,0.999,if(val1D < -0.99,-0.999,val1D)); fishD := 0.5*log((1 + value1D)/(1 - value1D))+0.5*previous; prE:= sectorE; maxhE := highest(prE,prd); minlE := lowest(prE,prd); val1E := 0.33*2*((prE - minlE)/(maxhE - minlE) - 0.5) + 0.67*previous; value1E := if(val1E > 0.99,0.999,if(val1E < -0.99,-0.999,val1E)); fishE := 0.5*log((1 + value1E)/(1 - value1E))+0.5*previous; prF:= sectorF; maxhF := highest(prF,prd); minlF := lowest(prF,prd); val1F := 0.33*2*((prF - minlF)/(maxhF - minlF) - 0.5) + 0.67*previous; value1F := if(val1F > 0.99,0.999,if(val1F < -0.99,-0.999,val1F)); fishF := 0.5*log((1 + value1F)/(1 - value1F))+0.5*previous; Filt := fish; Trend:=if(Filt> Hist(Filt,1),1,if(Filt<Hist(Filt,1),-1,prev)); [drawundefined=gap] [name="Chart"; color=Black; width=6] ef1:=if(Trend=1 and hist(Trend,1)=-1,Filt,if(Trend=-1,Filt,undefined)); ef1; [Color=Red] ef2:=if(Trend=-1 ,Filt,if(hist(Trend,1)=1 ,Filt,undefined)); ef2; [Color=Black] ef3:=if(Trend=1 or Trend=0,Filt,undefined); ef3; [name="ASX 200"; color=BLUE; width=2] trig2:=fish2; trig2; [name="Consumer Discret"; color=Cyan; width=2] trig3:=fish3; trig3; [name="Consumer Staple"; color=Green; width=2] trig4:=fish4; trig4; [name="Energy"; color=Red; width=2] trig5:=fish5; trig5; [name="Financials"; color=Orange; width=2] trig6:=fish6; trig6; [name="Health Care"; color=Dark Violet; width=2] trig7:=fish7; trig7; [name="Industrial"; color=Olive Drab; width=2] trig8:=fish8; trig8; [name="Info Tech"; color=Olive Drab; width=2] trig9:=fish9; trig9; [name="Metal and Mining"; color=turquoise; width=2] trigA:=fishA; trigA; [name="Resources"; color=violet; width=2] trigB:=fishB; trigB; [name="Teleco"; color=Tan; width=2] trigC:=fishC; trigC; [name="Utilities"; color=Dodger Blue; width=2] trigD:=fishD; trigD; [name="All Ord Gold"; color=Gold; width=2] trigE:=fishE; trigE; [name="Metals & Mining"; color=Black; width=2] trigF:=fishF; trigF; [name="average"; color=black; width=2] (Trig2+Trig3+Trig4+Trig5+Trig6+Trig7+Trig8+Trig9+TrigA+TrigB+TrigC+TrigD+TrigE+TrigF)/14; Edited by cmacdon - 11 Sep 2014 at 4:15pm |
|
|
BC User since June 2007
|
|
 |
|
cmacdon 
BullCharts Guru 
Joined: 09 Sep 2012 Location: Brisbane Posts: 236 |
 Post Options Post Options
 Quote Quote  Reply Reply
 Posted: 11 Sep 2014 at 4:17pm Posted: 11 Sep 2014 at 4:17pm |
|
{Here is FT for selected Stocks within a sector}
[description="Universal Relative Strength Comparison, Max" CMD Adapted to Fisher Transform] prd:= input(" length", 10, 1, 50); {symb := inputsymbol("ASX 200", "XJO");} sec1 := inputsymbol("Metals & Mining ", "Chart"); sec2 := inputsymbol("Metals & Mining", "AGO"); sec3 := inputsymbol("Metals & Mining", "ARI"); sec4 := inputsymbol("Metals & Mining", "AWC"); sec5 := inputsymbol("Metals & Mining", "BHP"); sec6 := inputsymbol("Metals & Mining", "BSL"); sec7 := inputsymbol("Metals & Mining", "FMG"); sec8 := inputsymbol("Metals & Mining", "ILU"); sec9 := inputsymbol("Metals & Mining", "NCM"); secA := inputsymbol("Metals & Mining", "RIO"); {index:=LoadSymbol(symb,C);} sector1:=LoadSymbol(sec1,C); sector2:=LoadSymbol(sec2,C); sector3:=LoadSymbol(sec3,C); sector4:=LoadSymbol(sec4,C); sector5:=LoadSymbol(sec5,C); sector6:=LoadSymbol(sec6,C); sector7:=LoadSymbol(sec7,C); sector8:=LoadSymbol(sec8,C); sector9:=LoadSymbol(sec9,C); sectorA:=LoadSymbol(secA,C); pr := C; maxh := highest(pr,prd); minl := lowest(pr,prd); val1 := 0.33*2*((pr - minl)/(maxh - minl) - 0.5) + 0.67*previous; value1 := if(val1 > 0.99,0.999,if(val1 < -0.99,-0.999,val1)); fish := 0.5*log((1 + value1)/(1 - value1))+0.5*previous; pr2 := sector2; maxh2 := highest(pr2,prd); minl2 := lowest(pr2,prd); val12 := 0.33*2*((pr2 - minl2)/(maxh2 - minl2) - 0.5) + 0.67*previous; value12 := if(val12 > 0.99,0.999,if(val12 < -0.99,-0.999,val12)); fish2 := 0.5*log((1 + value12)/(1 - value12))+0.5*previous; pr3 := sector3; maxh3 := highest(pr3,prd); minl3 := lowest(pr3,prd); val13 := 0.33*2*((pr3 - minl3)/(maxh3 - minl3) - 0.5) + 0.67*previous; value13 := if(val13 > 0.99,0.999,if(val13 < -0.99,-0.999,val13)); fish3 := 0.5*log((1 + value13)/(1 - value13))+0.5*previous; pr4 := sector4; maxh4 := highest(pr4,prd); minl4 := lowest(pr4,prd); val14 := 0.33*2*((pr4 - minl4)/(maxh4 - minl4) - 0.5) + 0.67*previous; value14 := if(val14 > 0.99,0.999,if(val14 < -0.99,-0.999,val14)); fish4 := 0.5*log((1 + value14)/(1 - value14))+0.5*previous; pr5 := sector5; maxh5 := highest(pr5,prd); minl5 := lowest(pr5,prd); val15 := 0.33*2*((pr5 - minl5)/(maxh5 - minl5) - 0.5) + 0.67*previous; value15 := if(val15 > 0.99,0.999,if(val15 < -0.99,-0.999,val15)); fish5 := 0.5*log((1 + value15)/(1 - value15))+0.5*previous; pr6 := sector6; maxh6 := highest(pr6,prd); minl6 := lowest(pr6,prd); val16 := 0.33*2*((pr6 - minl6)/(maxh6 - minl6) - 0.5) + 0.67*previous; value16 := if(val16 > 0.99,0.999,if(val16 < -0.99,-0.999,val16)); fish6 := 0.5*log((1 + value16)/(1 - value16))+0.5*previous; pr7 := sector7; maxh7 := highest(pr7,prd); minl7 := lowest(pr7,prd); val17 := 0.33*2*((pr7 - minl7)/(maxh7 - minl7) - 0.5) + 0.67*previous; value17 := if(val17 > 0.99,0.999,if(val17 < -0.99,-0.999,val17)); fish7 := 0.5*log((1 + value17)/(1 - value17))+0.5*previous; pr8 := sector8; maxh8 := highest(pr8,prd); minl8 := lowest(pr8,prd); val18 := 0.33*2*((pr8 - minl8)/(maxh8 - minl8) - 0.5) + 0.67*previous; value18 := if(val18 > 0.99,0.999,if(val18 < -0.99,-0.999,val18)); fish8 := 0.5*log((1 + value18)/(1 - value18))+0.5*previous; pr9 := sector9; maxh9 := highest(pr9,prd); minl9 := lowest(pr9,prd); val19 := 0.33*2*((pr9 - minl9)/(maxh9 - minl9) - 0.5) + 0.67*previous; value19 := if(val19 > 0.99,0.999,if(val19 < -0.99,-0.999,val19)); fish9 := 0.5*log((1 + value19)/(1 - value19))+0.5*previous; prA := sectora; maxhA := highest(prA,prd); minlA := lowest(prA,prd); val1A := 0.33*2*((prA - minlA)/(maxhA - minlA) - 0.5) + 0.67*previous; value1A := if(val1A > 0.99,0.999,if(val1A < -0.99,-0.999,val1A)); fishA := 0.5*log((1 + value1A)/(1 - value1A))+0.5*previous; Filt := fish; Trend:=if(Filt> Hist(Filt,1),1,if(Filt<Hist(Filt,1),-1,prev)); [drawundefined=gap] [name="Chart"; color=Black; width=6] ef1:=if(Trend=1 and hist(Trend,1)=-1,Filt,if(Trend=-1,Filt,undefined)); ef1; [Color=Red] ef2:=if(Trend=-1 ,Filt,if(hist(Trend,1)=1 ,Filt,undefined)); ef2; [Color=Black] ef3:=if(Trend=1 or Trend=0,Filt,undefined); ef3; [name="AGO"; color=BLUE; width=2] trig2:=fish2; trig2; [name="ARI"; color=Cyan; width=2] trig3:=fish3; trig3; [name="AWC"; color=Green; width=2] trig4:=fish4; trig4; [name="BHP"; color=Red; width=2] trig5:=fish5; trig5; [name="BSL"; color=Orange; width=2] trig6:=fish6; trig6; [name="FMG"; color=Dark Violet; width=2] trig7:=fish7; trig7; [name="ILU"; color=Olive Drab; width=2] trig8:=fish8; trig8; [name="NCM"; color=Slate Blue; width=2] trig9:=fish9; trig9; [name="RIO"; color=turquoise; width=2] trigA:=fishA; trigA; |
|
|
BC User since June 2007
|
|
 |
|
Alan 
Newbie 
Joined: 05 Sep 2014 Location: Australia Posts: 8 |
 Post Options Post Options
 Quote Quote  Reply Reply
 Posted: 11 Sep 2014 at 8:55pm Posted: 11 Sep 2014 at 8:55pm |
|
Hi Charles,
Thanks for the codes. I'll give these a try in BC and see what I get. Thanks, Alan
|
|
 |
|
Post Reply 
|
| Forum Jump | Forum Permissions  You cannot post new topics in this forum You cannot reply to topics in this forum You cannot delete your posts in this forum You cannot edit your posts in this forum You cannot create polls in this forum You cannot vote in polls in this forum |