 |
Welles Wilder Super Trend |
Post Reply 
|
| Author | |
meldeans 
Newbie 
Joined: 13 Feb 2009 Posts: 8 |
 Post Options Post Options
 Quote Quote  Reply Reply
 Topic: Welles Wilder Super Trend Topic: Welles Wilder Super TrendPosted: 09 Dec 2020 at 2:02pm |
|
Sorry for the delay response - thought i had email notification set on my post but didn't.
Thanks Maximo - works a treat. Really appreciate it.
 |
|
 |
|
maximo 
BullCharts Guru 
Joined: 02 Sep 2006 Location: Australia Posts: 232 |
 Post Options Post Options
 Quote Quote  Reply Reply
 Posted: 04 Dec 2020 at 4:24am Posted: 04 Dec 2020 at 4:24am |
|
It probably doesn't constantly show a 1 or 0 due to the 'undefined' output for changing the line colours. This similar indicator is easier to adapt. The last line should provide the digital output you're looking for. { Stop Trail ATR } [Target=price] atrper :=Input("ATR period: ",14); atrfact:=Input("ATR multiplier: ",2); loss:=atrfact*ATR(atrper); trail:= If(C>PREV and Ref(C,-1)>PREV, Max(PREV,C-loss), If(C<PREV and Ref(C,-1)<PREV, Min(PREV,C+loss), If(C>PREV, C-loss, C+loss))); Trail; { digital signal: if close is above previous value it's in buy(1) else it's in sell(0) } direction := if(close>prev,1,0); Edited by maximo - 06 Dec 2020 at 11:19pm |
|
 |
|
maximo 
BullCharts Guru 
Joined: 02 Sep 2006 Location: Australia Posts: 232 |
 Post Options Post Options
 Quote Quote  Reply Reply
 Posted: 04 Dec 2020 at 2:12am Posted: 04 Dec 2020 at 2:12am |
|
Edited by maximo - 06 Dec 2020 at 11:20pm |
|
 |
|
meldeans 
Newbie 
Joined: 13 Feb 2009 Posts: 8 |
 Post Options Post Options
 Quote Quote  Reply Reply
 Posted: 26 Nov 2020 at 3:48pm Posted: 26 Nov 2020 at 3:48pm |
|
Hi,
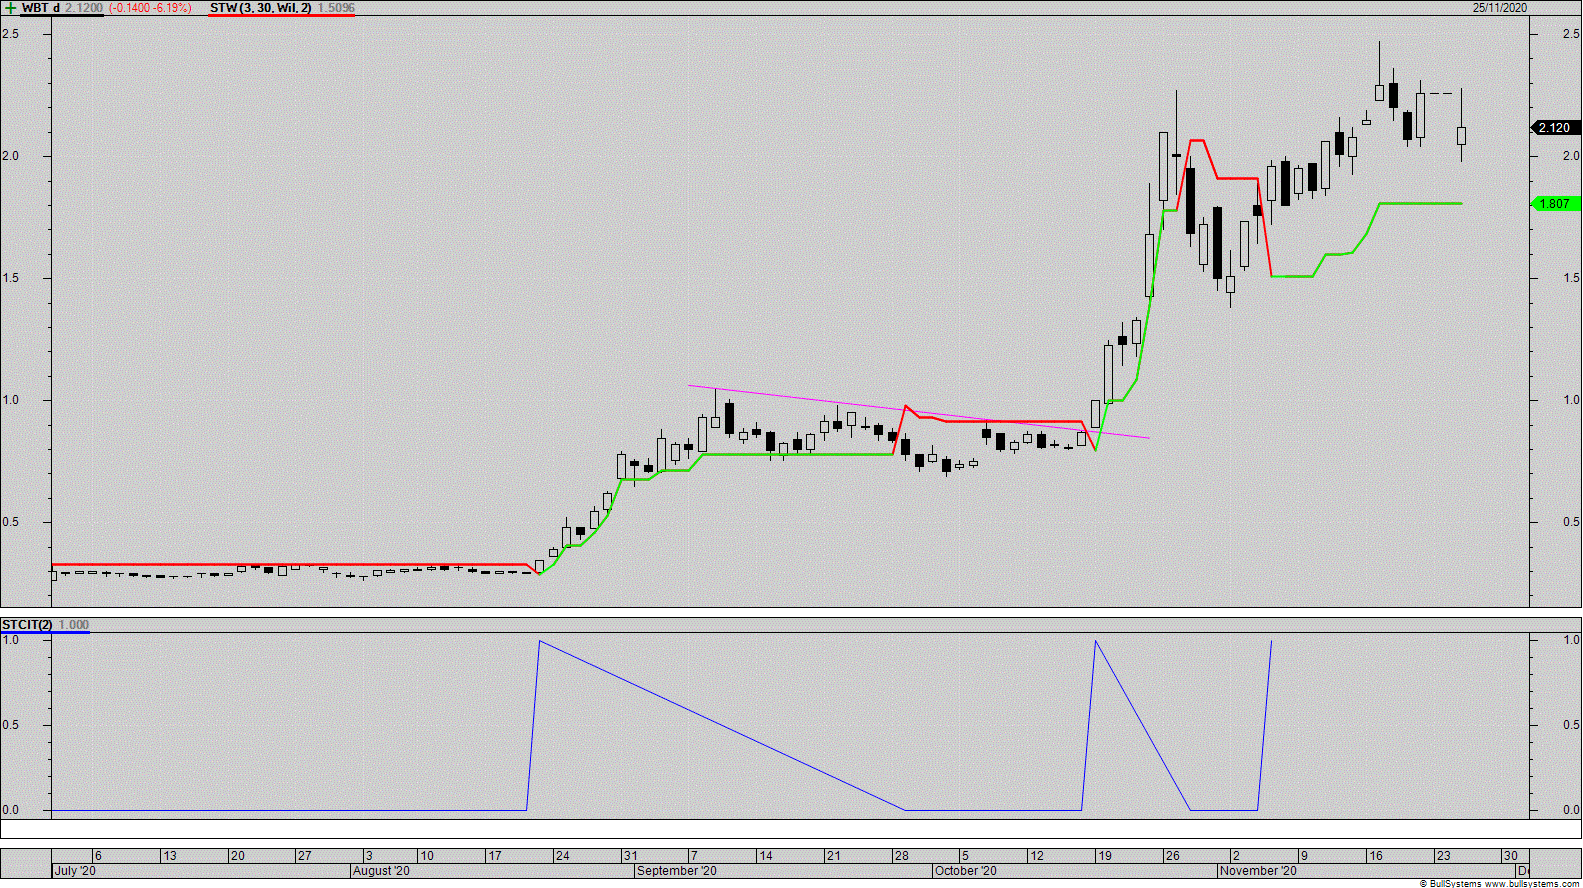
Can anyone help with some issues I am having with Super Trend indicators? I am using the indicator to trade long only in SMSF. I only want to take signals when price is trading above the indicator. None of my indicators with my criteria work when i include the code line: c>Formula("Super Trend Wilders", 3, 30, Wilders, 2). I have copied this formula I presume off here somewhere as below: {==== BullScript ====} [Description="SuperTrend - Max"] [target=price] Mult:=Input("ATR Multiplier",3,1); Nb:=Input("Nb Periods",8,1); method:=inputma("Method",Wilders); price:=Input("1=Median, 2=Close",1,1); TruRan:=ma(ATR(1),Nb,method)*Mult; HiLimit:=if(price=1,(H+L)/2-TruRan,C-TruRan); LoLimit:=if(price=1,(H+L)/2+TruRan,C+TruRan); LB:=If(HiLimit>=PREV and HiLimit<C,HiLimit,If(C<PREV,HiLimit-0.1,PREV)); UB:=If(LoLimit<PREV and LoLimit>C,LoLimit,If(C>PREV,LoLimit+0.1,PREV)); Trend:=if(UB>ref(UB,-1),1,if(LB<ref(LB,-1),-1,prev)); [drawundefined=gap] [Color=lime green] if(Trend=1 and hist(Trend,1)=-1,LB,if(Trend=-1,UB,undefined)); [Color=red] if(Trend=-1 ,UB,if(hist(Trend,1)=1 ,LB,undefined)); [Color=lime green] if(Trend=1 or Trend=0,LB,undefined); When I display the Super Trend indicator in a pane all of its own so it should show "0" when price below indicator and "1" when above. It only shows "1" when price crosses above when it immediately does not each day that it is true. Appreciate any help. Thanks Dean  |
|
 |
|
Post Reply 
|
| Forum Jump | Forum Permissions  You cannot post new topics in this forum You cannot reply to topics in this forum You cannot delete your posts in this forum You cannot edit your posts in this forum You cannot create polls in this forum You cannot vote in polls in this forum |